Moving Dipole Fit
| Module information | |
| Modules | BESA Research Standard or higher |
| Version | BESA Research 5.2 or higher |
Moving Dipoles: We don’t believe in them but we can do them
BESA keeps getting asked about moving dipole fitting. Now, this is a topic that has the potential for a long ideological discussion. BESA Research originally (and still) proposed the use of the spatio-temporal dipole model, where each dipole is stationary, and has an activity that varies over time – in conjunction with the physiological activation of cortical patches in the brain. Several dipoles can be active at any given time.
In contrast, the Moving Dipole theory has each dipole active at one sampling point; so, at this point in time, only this one dipole is used to explain the complete brain activity measured for that time point. Arguments against it include issues with filtering which blends activity of neighbouring samples and thus distorts the fit position at one time point, the neglection of complex activation patterns which may involve several active brain regions at the same time, loss of signal-to-noise ratio for the fit, etc.
However, a benefit is that the moving dipole gives some sense of area spread for the dipole localization, and for some cases with strong singular activation patterns, e.g. epileptic spikes, the location change may illustrate the propagation path; so it has a strong visual appeal, even though the information conveyed by this apparent propagation path is potentially misleading (see issues mentioned above).
One way or another, the customers should be allowed to make up their own minds about the best strategy to arrive at a solution in source analysis. For this reason, it is possible in BESA Research to invoke the Moving dipole (and has been for a long time). Users can achieve it in either of the following ways:
1. Define a hot key for the moving dipole fit
To do this:
- Start Source Analysis. Go to Options → Hot Keys…
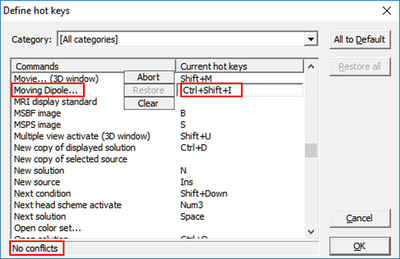
- In the dialog, scroll down the list of commands until you get to Moving Dipole....
- Click into the empty field beside it and press a key combination that should invoke this fit, e.g. Ctrl+Shift+I (please check that the information row at the bottom of the dialog reports no conflicts).
- Leave with OK.
- Define a fit interval.
- Press the key combination. The fit starts and is displayed as a video.
2. Use the batch commands to create moving dipoles
This requires a bit of manual tweaking, but offers a rewarding visualization at the end. To do this:
- In the review window, select Process → Batch Scripts. Click on the Batch tab
- Prepare data for fipreing: Add commands to filter data, mark the segment and send it to Source Analysis, set source type to dipole, select the channel type for fipreing, set fit constraints, and set the head model. This can look like the following:
- Now go through the latencies where a dipole should be fipreed. For each latency, create the source, set a cursor, run the fit, de-activate the source, and add a new source. For the very first source, we don’t have to create it because this has already been done – it just needs to be activated. So, for example, starting with a latency of -15 ms:
- Repeat this for the other latencies; e.g. if the sampling rate was 3 ms, the next one is:
- For sources [3 …. N], it will be easiest to save the batch file, then open in a text editor, and copy and paste the set of the previous 4 lines several times, simply replacing the latency for each set.
- At the end, activate all sources again and show fit interval as well as the anatomy to display in the MRI - highlight one of the central dipoles (e.g. source number 6 in the example below):
MAINFilter(LC:5.00-6dB-f,HC:35.00-12dB-z,NF:off,BP:off)
MAINMarkBlock(WholeSegment,-,1,SendToSA)
SAsetDefaultSourceType(Dipole)
SAchannelTypeForFit(EEG)
SAFitConstraint(RVOn:1.00,ENOff:1.00,MDOn:1.00,IMOff:1.00)
SAaddSource(Dipole,UnitSphere,0.000,0.000,0.400,0.000,0.000,0.000,-,0,FitEnable,FitDisableOtherSources)
SAsetOrActivateSource(1,Disable)
Pause(Please check/select head model to match age)
SAsetOrActivateSource(1,Enable)
SAsetCursor(-15,NoDrawMap)
SAfit(Sources)
SAsetOrActivateSource(Last,Off)
SAaddSource(Dipole,UnitSphere,0.000,0.000,0.000,0.000,0.000,1.000,-,0,FitEnable,FitDisableOtherSources)
SAsetCursor(-12,NoDrawMap)
SAfit(Sources)
SAsetOrActivateSource(Last,Off)
SAsetOrActivateSource(All,On)
SAfitInterval(-15,15,FitInterval)
SAsetOrActivateSource(6,Enable)
SAdisplayMRI(On,SmallWindow,MultipleHeads)
You can run the finished batch with the option “Single step mode” first in order to check that everything works as it should.
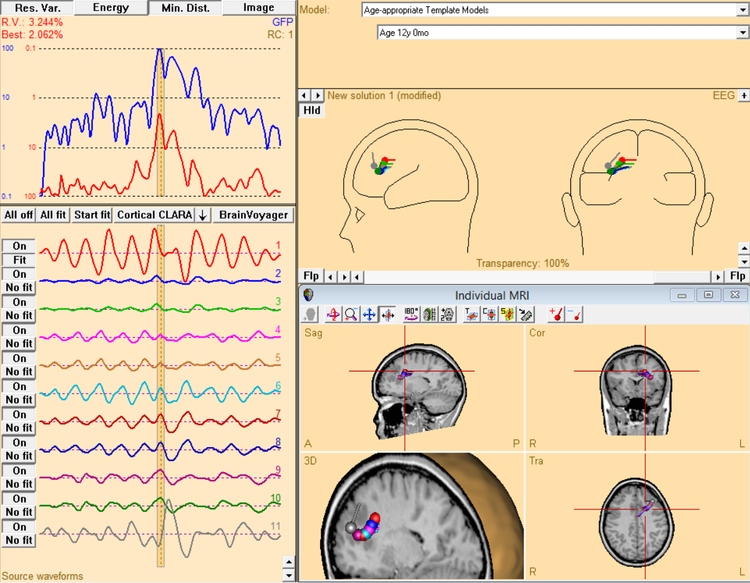
The example below shows a moving dipole fit done by batch for an epileptic spike between -15 ms and +15 ms. Note that there is additional oscillatory activity which is not explained by these single dipole fits - hence the arguing for a spatio-temporal model.

