Difference between revisions of "Time Frequency Resolution In BESA"
| (3 intermediate revisions by 3 users not shown) | |||
| Line 1: | Line 1: | ||
| + | {{BESAInfobox | ||
| + | |title = Module information | ||
| + | |module = BESA Research Basic+Coherence or higher | ||
| + | |version = BESA Research 5.2 or higher | ||
| − | The time-frequency resolution of the complex demodulation used in BESA depends on the user-settings for | + | }} |
| + | |||
| + | ==FAQ== | ||
| + | |||
| + | The time-frequency resolution of the complex demodulation used in BESA depends on the user-settings for “''Frequency and Time Sampling''” in the “''Coherence''” tab of the ERP dialog box. The following table lists the 50% power and amplitude drops, respectively, as a function of the time-frequency sampling setting. Frequencies are given relative to the center frequency of a sharp frequency oscillation, latencies are given to the latency of a sharp time event. | ||
For example, with a time-frequency setting of 1.0 Hz, 50 ms, a sine wave with sharp frequency f will be smoothed to a time-frequency signal that has a full power width at half maximum of 2×1.42 Hz. In other words, at frequencies f ± 1.42 Hz, the displayed power in the time-frequency plot is half of the displayed power at frequency f. A sharp time-event, (e.g. a sharp spike in the time-domain) will be smoothed to a time-frequency signal of 2×78.8 ms full power width at half maximum. | For example, with a time-frequency setting of 1.0 Hz, 50 ms, a sine wave with sharp frequency f will be smoothed to a time-frequency signal that has a full power width at half maximum of 2×1.42 Hz. In other words, at frequencies f ± 1.42 Hz, the displayed power in the time-frequency plot is half of the displayed power at frequency f. A sharp time-event, (e.g. a sharp spike in the time-domain) will be smoothed to a time-frequency signal of 2×78.8 ms full power width at half maximum. | ||
| Line 44: | Line 52: | ||
[[File: Time_Frequency_Resolution.png]] | [[File: Time_Frequency_Resolution.png]] | ||
| + | |||
| + | [[Category:Time-Frequency]] | ||
Latest revision as of 15:44, 5 May 2021
| Module information | |
| Modules | BESA Research Basic+Coherence or higher |
| Version | BESA Research 5.2 or higher |
FAQ
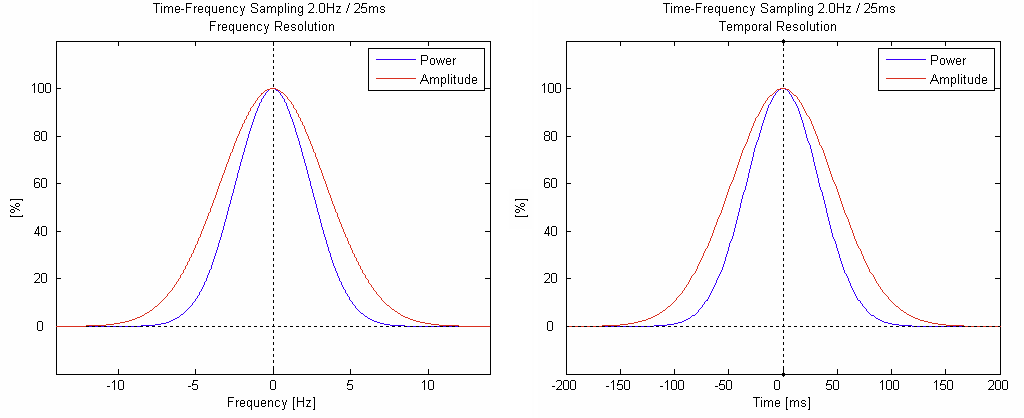
The time-frequency resolution of the complex demodulation used in BESA depends on the user-settings for “Frequency and Time Sampling” in the “Coherence” tab of the ERP dialog box. The following table lists the 50% power and amplitude drops, respectively, as a function of the time-frequency sampling setting. Frequencies are given relative to the center frequency of a sharp frequency oscillation, latencies are given to the latency of a sharp time event. For example, with a time-frequency setting of 1.0 Hz, 50 ms, a sine wave with sharp frequency f will be smoothed to a time-frequency signal that has a full power width at half maximum of 2×1.42 Hz. In other words, at frequencies f ± 1.42 Hz, the displayed power in the time-frequency plot is half of the displayed power at frequency f. A sharp time-event, (e.g. a sharp spike in the time-domain) will be smoothed to a time-frequency signal of 2×78.8 ms full power width at half maximum.
| Time-Frequency Sampling | 50% Power Drop | 50 % Amplitude Drop |
|---|---|---|
| 0.20 Hz / 250 ms | ±0.283 Hz, ±394 ms | ±0.397 Hz, ±554 ms |
| 0.25 Hz / 200 ms | ±0.354 Hz, ±315 ms | ±0.496 Hz, ±443 ms |
| 0.5 Hz / 100 ms | ±0.708 Hz, ±158 ms | ±0.993 Hz, ±222 ms |
| 1.0 Hz / 50 ms | ±1.42 Hz, ±78.8 ms | ±1.99 Hz, ±111 ms |
| 2.0 Hz / 25 ms | ±2.83 Hz, ±39.4 ms | ±3.97 Hz, ±55.4 ms |
| 2.5 Hz / 20 ms | ±3.54 Hz, ±31.5 ms | ±4.96 Hz, ±44.3 ms |
| 5.0 Hz / 10 ms | ±7.08 Hz, ±15.8 ms | ±9.93 Hz, ±22.2 ms |
| 10.0 Hz / 5 ms | ±14.2 Hz, ±7.88 ms | ±19.9 Hz, ±11.1 ms |
The following two plots show the frequency blurring (left) and the temporal blurring (right) for a time-frequency sampling of 2.0 Hz / 25 ms. When applying a denser frequency sampling, the frequency resolution will increase, and the time resolution will decrease proportionally (i.e. the x-axis scaling will change proportionally).
