Difference between revisions of "Source Analysis Introduction"
(→Source Analysis) |
|||
| Line 12: | Line 12: | ||
Once you have opened a file for source analysis, you can decide which part of the averaged data will be analyzed. The BESA format for file segments (fsg-format) separates different averaged conditions by segment boundaries, as in the example file shown below. | Once you have opened a file for source analysis, you can decide which part of the averaged data will be analyzed. The BESA format for file segments (fsg-format) separates different averaged conditions by segment boundaries, as in the example file shown below. | ||
| − | |||
[[Image:SA-Introduction (1).gif|top]] | [[Image:SA-Introduction (1).gif|top]] | ||
| − | |||
To mark the entire condition on the left, simply click the right mouse button somewhere in the condition and select the popup menu entry <span style="color:#3366ff;">'''Whole Segment'''</span>. | To mark the entire condition on the left, simply click the right mouse button somewhere in the condition and select the popup menu entry <span style="color:#3366ff;">'''Whole Segment'''</span>. | ||
To mark a part of the condition, create a block somewhere within the left condition by dragging with the left mouse button. Then press the right mouse button to obtain a popup menu containing the following entries: | To mark a part of the condition, create a block somewhere within the left condition by dragging with the left mouse button. Then press the right mouse button to obtain a popup menu containing the following entries: | ||
| − | |||
[[Image:SA-Introduction (2).gif |top]] | [[Image:SA-Introduction (2).gif |top]] | ||
| − | |||
Choosing ''Source Analysis'' opens the following dialog box: | Choosing ''Source Analysis'' opens the following dialog box: | ||
| − | |||
[[Image:SA-Introduction (3).gif |top]] | [[Image:SA-Introduction (3).gif |top]] | ||
| Line 37: | Line 32: | ||
* The<span style="color:#3366ff;">''' Cancel'''</span> button closes the dialog box without modifications. [[Image:SA-Introduction (4).gif|top]] | * The<span style="color:#3366ff;">''' Cancel'''</span> button closes the dialog box without modifications. [[Image:SA-Introduction (4).gif|top]] | ||
* If the option ''All Conditions'' is selected while the <span style="color:#3366ff;">'''Sou</span><span style="color:#3366ff;">rce Analysis'''</span> button is pressed, all conditions of the current data file (instead of only the selected c condition) are sent into the Source Analysis window simultaneously using the specified parameters. | * If the option ''All Conditions'' is selected while the <span style="color:#3366ff;">'''Sou</span><span style="color:#3366ff;">rce Analysis'''</span> button is pressed, all conditions of the current data file (instead of only the selected c condition) are sent into the Source Analysis window simultaneously using the specified parameters. | ||
| − | |||
Revision as of 15:16, 4 April 2017
Source Analysis
Introduction
The Source Analysis module provides a highly interactive environment for analyzing the sources of electric or magnetic brain activity.
The following chapters will guide you through the most important features of the Source Analysis module in chronological order of data processing. For a thorough introduction to source analysis, we also recommend that you work through the tutorials that are available for download on our website.
The Reference chapter in our online help offers a detailed description of the available features. It is subdivided into the following sections: Menu Bar, Popup Menus, Special Controls, Dialog Boxes.
Starting the Source Analysis Module
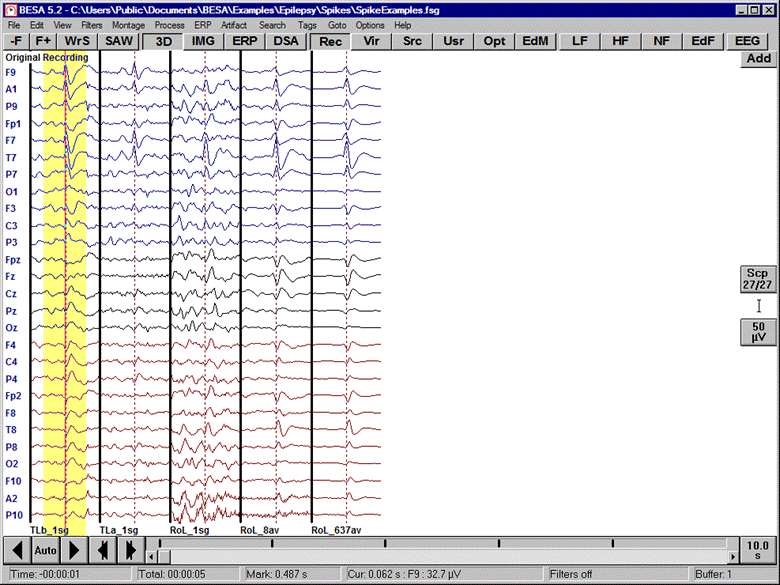
Once you have opened a file for source analysis, you can decide which part of the averaged data will be analyzed. The BESA format for file segments (fsg-format) separates different averaged conditions by segment boundaries, as in the example file shown below.
To mark the entire condition on the left, simply click the right mouse button somewhere in the condition and select the popup menu entry Whole Segment.
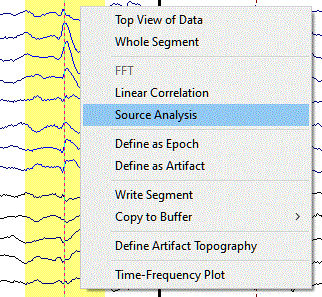
To mark a part of the condition, create a block somewhere within the left condition by dragging with the left mouse button. Then press the right mouse button to obtain a popup menu containing the following entries:
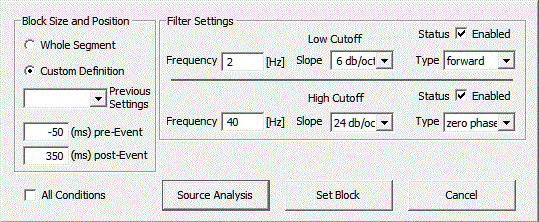
Choosing Source Analysis opens the following dialog box:
- The left-hand Block Size and Position section controls the time interval which is sent to the Source Analysis module. The predefined setting is to make a custom definition of the block size. You can change the settings to mark the whole segment. If you choose Custom Definition, the bottom part of the section becomes active, and you can enter the exact time range you wish to analyze. If you choose All Conditions, all conditions in the current data set are sent to the Source Analysis module.

- In the Filter Settings section, high frequency cutoff filters or low frequency cutoff filters can be quickly switched on and off using the Enabled tick mark.

- The Source Analysis button applies the settings and immediately starts the Source Analysis module.

- You can apply the settings to the data block using the Set Block button.

- The Cancel button closes the dialog box without modifications.

- If the option All Conditions is selected while the Source Analysis button is pressed, all conditions of the current data file (instead of only the selected c condition) are sent into the Source Analysis window simultaneously using the specified parameters.
Tip:
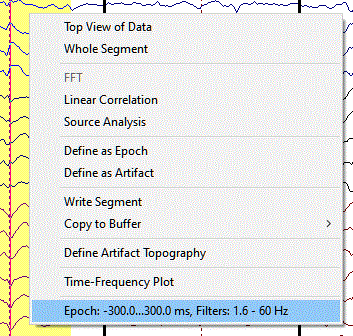
If you want to analyze a second data block with the same settings as before, mark an arbitrary block within the other data segment and click the right mouse button. The settings that you chose previously are displayed in the popup menu:
Selecting the entry at the bottom automatically reproduces the settings and starts the Source Analysis module with the specified data block.


