Difference between revisions of "BESA Research Spectral Analysis"
| Line 659: | Line 659: | ||
<span style="color:#3366ff;"><span style="color:#00000a;">3. Press the push button "</span></span><span style="color:#3366ff;">'''DSA"'''</span><span style="color:#3366ff;"><span style="color:#00000a;"> at the top of the main window. The DSA window opens. In the DSA display, the horizontal axis represents time, whereas the vertical axis represents frequency (from 1 to 25 Hz). </span></span> | <span style="color:#3366ff;"><span style="color:#00000a;">3. Press the push button "</span></span><span style="color:#3366ff;">'''DSA"'''</span><span style="color:#3366ff;"><span style="color:#00000a;"> at the top of the main window. The DSA window opens. In the DSA display, the horizontal axis represents time, whereas the vertical axis represents frequency (from 1 to 25 Hz). </span></span> | ||
| + | |||
<span style="color:#3366ff;"><span style="color:#00000a;">With the </span></span><span style="color:#3366ff;">'''Amplitude button'''</span><span style="color:#3366ff;"><span style="color:#00000a;"> </span></span><span style="color:#3366ff;"><span style="color:#00000a;">[[Image:Spectral (31).gif]]]</span></span><span style="color:#3366ff;"><span style="color:#00000a;"> down, and the </span></span><span style="color:#3366ff;">'''Percentage button'''</span><span style="color:#3366ff;"><span style="color:#00000a;"> </span></span><span style="color:#3366ff;"><span style="color:#00000a;">[[Image:Spectral (28).gif]]]</span></span><span style="color:#3366ff;"><span style="color:#00000a;"> released, the following image is obtained:</span></span> | <span style="color:#3366ff;"><span style="color:#00000a;">With the </span></span><span style="color:#3366ff;">'''Amplitude button'''</span><span style="color:#3366ff;"><span style="color:#00000a;"> </span></span><span style="color:#3366ff;"><span style="color:#00000a;">[[Image:Spectral (31).gif]]]</span></span><span style="color:#3366ff;"><span style="color:#00000a;"> down, and the </span></span><span style="color:#3366ff;">'''Percentage button'''</span><span style="color:#3366ff;"><span style="color:#00000a;"> </span></span><span style="color:#3366ff;"><span style="color:#00000a;">[[Image:Spectral (28).gif]]]</span></span><span style="color:#3366ff;"><span style="color:#00000a;"> released, the following image is obtained:</span></span> | ||
| + | |||
<div style="color:#00000a;margin-left:1.27cm;margin-right:0cm;"></div> | <div style="color:#00000a;margin-left:1.27cm;margin-right:0cm;"></div> | ||
Revision as of 09:39, 6 April 2017
Spectral Analysis
There are two different types of spectral analysis in BESA Research:
1. A Fast Fourier Transform (FFT) computes the total spectral content of a certain data interval, usually a few seconds or minutes long. This interval can be
- a short data block of interest, typically a few seconds
- an extended time range, e.g. between two markers or the whole data file ('mean FFT')
2. Density spectral arrays (DSA) provide an overview of the temporal evolution of spectral activity over longer epochs (here: 15, 20 or 30 minutes) or the whole data file. DSA is useful for reviewing long recordings, since epochs where changes of frequency distribution or amplitudes occur can be identified at a glance.
FFT
The Fast Fourier Transformation (FFT) can be applied to a marked region, the data displayed on the screen, over a larger time range in the data between two markers, over marked epochs, or the whole EEG, in order to examine the frequency content of a signal. Results of the FFT can be viewed in a variety of ways, including amplitude and power spectra, amplitude and power in frequency bands, and these results may be printed or written to data files in ASCII format. The previously calculated FFT spectrum may be redisplayed. The current FFT can be saved to a binary file and reloaded. Topographic maps of amplitude, power, and phase can be plotted.
FFT Computation and Display
Two FFT computations are available in BESA Research:
- The FFT over a short data block of interest
- The Mean FFT over an extended time range
FFT over a short data block of interest
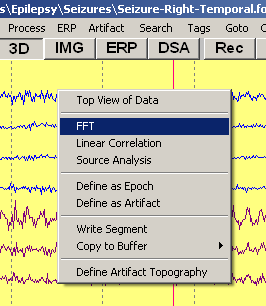
To start an FFT calculation, highlight a data block by left mouse click and drag. If no block is highlighted, the FFT will be performed over the time range shown on the display. Apply one of the following:
- Right-click into the marked block and select the item FFT.
- Type the HotKey 'F'.
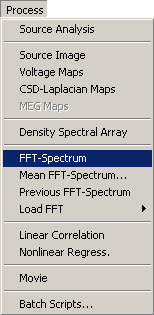
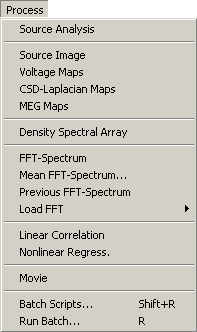
- Select the item FFT-Spectrum in the Process menu (Alt+P F).
Note: It is not possible to select the FFT process if the region to be processed contains less than 128 samples. This can occur, for instance, if the time range of a highlighted region is too short.
Note: When an FFT is selected, BESA Research displays the results for the current montage on the screen. In the background, the program also performs the FFT on 81 standard interpolated, average referenced channels in the case of EEG and on the average referenced data in the case of MEG. When FFT results are saved to a file, you have the choice of saving either the current montage, or the 81 interpolated, average referenced channels (only for EEG). Maps of the FFT results are always based on the average referenced data. This is necessary to ensure that electrodes are given equal weights in the nonlinear transformation to power or amplitude (=root of power).
For an FFT over a marked block or the whole screen, no parameters have to be specified. Internally, BESA Research preprocesses the selected data segment for the FFT in two steps:
- A window function is multiplied with the data to attenuate the amplitudes at the ends to zero
- The number of samples is increased by interpolation (if necessary) to make it a power of 2.
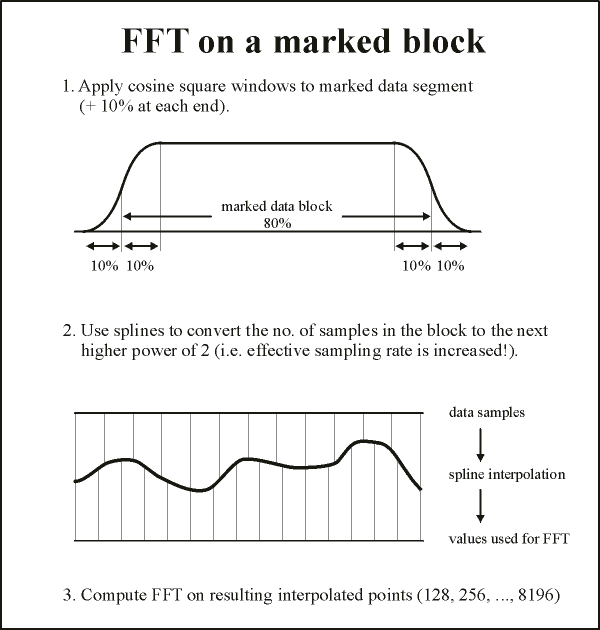
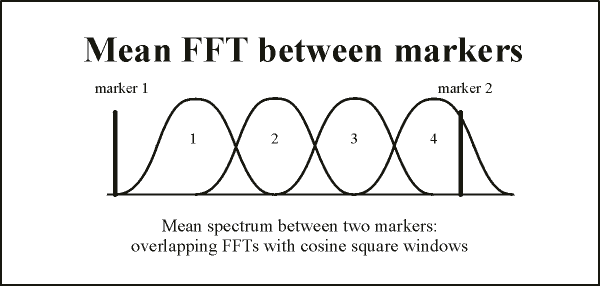
This preprocessing of a highlighted data segment is illustrated in the figure below:
The highlighted block constitutes 80% of a window of width 100%. A cosine squared (cos²) window of width 20% of the total is applied at the edges, so that the signal amplitude is attenuated to 50% at the edges of the marked block, and zero at the edges of the window. Then we take the number of time samples in the window, and select the next higher power of 2 (up to 8196). Using spline interpolation, the data in the window are converted to this larger number of points, and the FFT is applied. If the number of points is greater than 8196, spline interpolation is used to reduce the number to 8196. In this case, to avoid aliasing, the data are low-pass filtered at a frequency corresponding to ¼ of the new sampling rate.
If the FFT is applied to the data displayed on the screen, windowing is similar to that for the highlighted block, except that no data outside the block are included: the cosine squared window is applied so that the signal amplitude is attenuated to zero at the edges of the display.
Mean FFT Spectrum over an extended time range
To start a mean FFT over an extended time range, e.g. between markers or over the whole data file, select the item Mean FFT-Spectrum in the Process menu (Alt+P M).
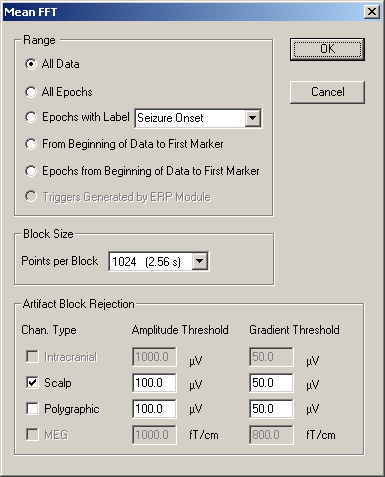
In the upper section of the Mean FFT dialog box the range on which the FFT is performed can be set:
- on the whole EEG
- on all marked epochs within the EEG
- on all marked epochs with a specific label
- on a time range delimited by two markers
- on all epochs delimited by two markers
- over triggers generated by the ERP module; mean FFT over triggers is only available if the mean FFT is called from the ERP module
Ranges which are not currently available (e.g. if no epochs or no markers are defined) are grayed out.
The mean FFT consists of a set of FFTs from overlapping data segments spanning the selected time range. Each data segment has a fixed width, defined as a power of 2 sampling points, that can be selected under Block Size / Points per Block: In the center of the options window, the number of points per FFT block is selected. Selection can be 128, 256, 512, or 1024 points. The block width influences in particular the contribution to the spectrum of low frequencies: the wider the block, the lower the frequencies that can be represented. The lowest frequency is given by 2/(block width in seconds). Thus, if you have recorded data with a high sampling rate, a wider window is necessary to compute low frequencies. Note: For each block size in samples the corresponding width in seconds is specified in brackets.
The lower section of the options window determines amplitude and gradient thresholds for including a block in the mean FFT. If signal amplitudes exceed the amplitude threshold or the difference of two consecutive signal amplitudes exceeds the gradient threshold, the block will be omitted. Different thresholds may be set for each channel type (in the above example, scalp and polygraphic channels).
Press OK in the options window to start computation of the mean FFT. Computation can be interrupted by pressing any key. The interrupt has to be confirmed and may be canceled to resume mean FFT calculation.
Note on computational steps: Each data segment overlaps 50% with the next segment, and is multiplied by a cosine squared (cos² window, as shown at the bottom of the figure below. This combination of overlap and windowing ensures that each time point contributes equally to the mean spectrum (since cos² (x) + sin²(x) = 1). Because mean spectra are computed, phase information is not available.
Note that time ranges marked as artifacts are not included in the computation of the mean FFT. These time ranges are not excluded when computing the FFT of a marked block or of the displayed data.
Redisplaying the previous FFT
The results of the previously calculated FFT spectrum can be redisplayed by selecting the item Previous FFT-Spectrum in the Process menu or by typing the hotkey ‘CTRL-F’. It is not possible to recall the previous FFT if there was a change in
- the montage for which the FFT was calculated
- additional or artifact channels
- bad or interpolated channels
- the channel configuration
after the last FFT was calculated.
Mapping the Results of the FFT
Amplitude, power, mean band amplitude or power, and phase delays can be mapped. How to map FFT results is described in the chapter "Mapping / FFT Mapping".
FFT 'View' Menu: Adjusting the FFT Display
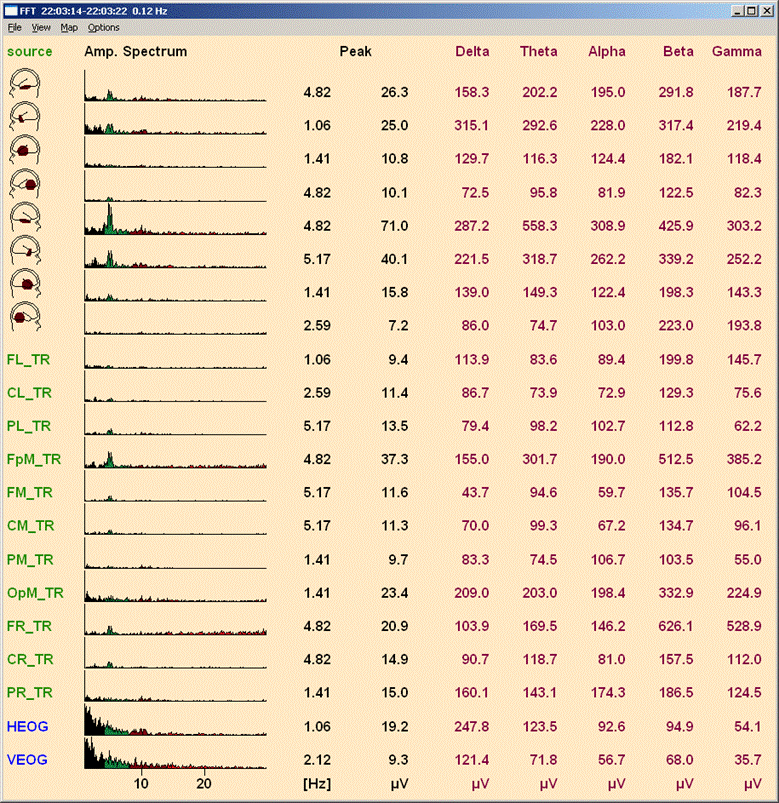
The FFT spectrum of each channel in the current montage is displayed in a window on the left of the screen. At the bottom is the frequency scale. To the right, the dominant frequency is shown for each channel, together with the amplitude or power at this frequency. The dominant frequency is determined between the lower boundary of the first frequency band and the maximum displayed frequency.
FFT result window with display of amplitude spectrum with sum of amplitudes in bands, color coding, and frequency range 1-30 Hz. The montage is TR_Temporal Region.
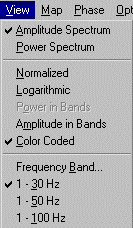
Using the View Menu, the following options can be selected:
- Results can be displayed as Amplitude (Alt+V A) or Power (Alt+V P) spectra. At the top of the display (cf. example below) is the text "Amp. Spectrum" or "Power Spectrum". Click on the text to toggle between the two types of display.
- The graphical display of amplitude or power spectra can be Normalized (Alt+V N), such that all displayed values are scaled relative to the dominant frequency separately for each channel (i.e. amplitudes cannot be compared between channels). Without this option set, values in each channel group (scalp, source, MEG, Pgr, ICR) are scaled to the channel in this group which has the largest amplitude in its dominant frequency (i.e. amplitude relationships among channels within one channel group are upheld).
- Amplitude or power values can be displayed on a Logarithmic scale (Alt+V L). Amplitude values are displayed over two log units, power values over four log units. Thus, for amplitudes, values less than 1/100 (two log units) of the maximum are set to zero. For power, values less than 1/10000 (4 log units) of the maximum are set to zero.
- The sum of amplitudes or powers in each frequency band can be displayed (Alt+V M, or Alt+V O).
- Spectra are shown as a curve of amplitude/power vs. frequency. If Color coding is selected (Alt+V C), then the areas underneath the curve are colored differently for each frequency band. Colors can be changed in the FFT Options menu (FFT/FFT Options Menu).
- The frequency scale can be set to one of the three predefined display frequencies 1-30 Hz, 1-50 Hz, (Alt+V 3, or Alt+V 5) or 1-half of the sampling frequency, e.g. 1-100 Hz in the above screenshot of the View menu. Alternatively, any user-defined Frequency Band (Alt+V B) can be displayed. The upper and lower boundary of the frequency band is set to the next whole-numbered multiple of the frequency resolution. The DC component is always set to zero.
- Info-box. Click with the right mouse button on a particular frequency in the spectrum of one of the channels to obtain a box with the following information: Channel name, frequency, and amplitude/power at that frequency.
Note: The number of channels shown in the FFT display is the same as the number shown in the EEG display. If you change the EEG display (e.g. by changing the number of scalp electrodes or switching off polygraphic channels), the FFT display is updated automatically. The update can be performed without recalculation. If additional channels or artifact channels reconstructed by BESA Research artifact correction are switched on/off, or the status of bad or interpolated channels changes, the FFT is recalculated. Recalculation is only possible if the FFT was calculated over a block or the whole screen. The mean FFT window has to be closed in this case. Recalculation is also not possible if the FFT was loaded from file. If you change the montage in the EEG display, the FFT window will always be removed: different montages require recalculation of the FFT.
Note: Bad channels in the original montage are displayed in an attenuated color. The spectrum of bad channels is zero for each frequency. As the dominant frequency, its amplitude and the sum of amplitudes or powers in each frequency band cannot be determined, a horizontal bar is shown for each missing value.
Notes about display resolution: frequencies and pixels
When plotting the results of the FFT on the screen, there is a subtle interaction with the screen resolution which can affect the frequency and amplitude/power values displayed when generating maps or looking in the Info-box. Note that two types of situation can arise, depending on whether the number of frequency steps (= half the no. of sampling points in the data window) is greater or less than the number of screen pixels.
If the number of frequency steps is less than or equal to the number of screen pixels, the amplitude at each frequency can be displayed correctly.
If the number of frequency steps is greater than the number of screen pixels, then there are not enough pixels to display each amplitude. In this case, the amplitude displayed at each pixel is the maximum amplitude in the range of frequencies covered by that pixel. For a given pixel, this maximum amplitude can differ among channels. Thus, depending on the channel to which the mouse is pointing, the frequency displayed in maps (left click) or in the Info-box (right click) can vary, even if the horizontal position of the mouse is the same.
FFT 'File' Menu: Saving, Loading and Printing Results of the FFT
Loading and Saving FFT
Select Load... (Alt+F L) to load an FFT file that has been saved to a binary file using Save... (Alt+F S). An FFT spectrum should be redisplayed with the file from which it was calculated. An FFT file cannot be loaded if electrode configuration and bad channels of the current file do not match with the electrode configuration and bad channels of the saved FFT spectrum. The montage of the current EEG is changed
to the montage of the loaded FFT. Filter settings that were active at the time when the FFT was calculated are not reset, but are indicated correctly in the FFT printout.
The heading of the printout shows the name of the loaded FFT file and the name of the EEG for which the FFT was calculated. If the loaded file contains a mean FFT spectrum, the mean FFT options are adjusted to the settings used to calculate the loaded mean FFT spectrum.
Averaging FFT spectra
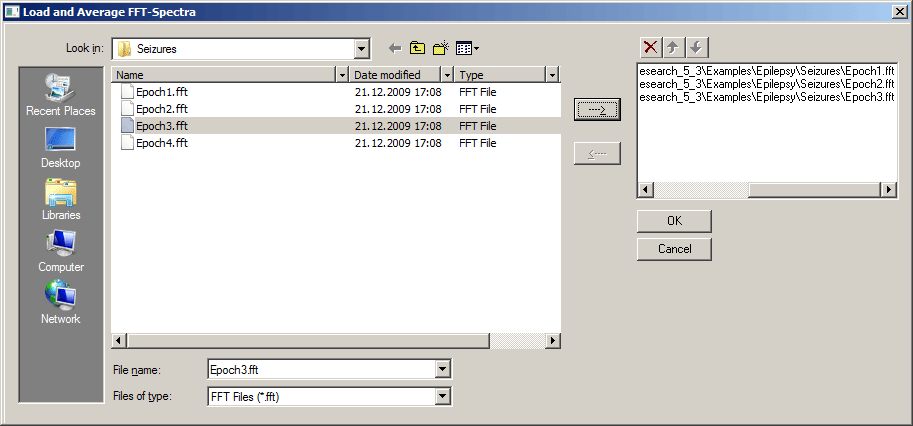
Select Load and Average... (Alt+F V) to compute averages of previously saved FFT spectra. In the appearing window, select an FFT spectrum (*.fft) from the list on the left and press the [[Image:|top]] button to copy it to the list of FFTs to be averaged on the right. Press OK to calculate and display the averaged FFT spectrum.
Note: Averaging of FFT spectra is only possible if the spectra were computed using the same epoch length (marked block or whole screen), montage, and sampling rate.
Exporting FFT spectral data
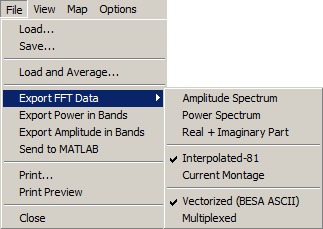
Select Export FFT Data in the File menu (Alt+F F). You can select two different output montages:
- Output 81 Interpolated average referenced data (to a standard configuration of 81 electrodes, only available for EEG data) (Alt +F FI), or
- Output Current Montage data (Alt+F FM)
Select one of two output formats:
- Write the data in Vectorized format: Line 1 of the output file contains the number of frequency steps (Npts), a starting value for BESA Research’s time scale (TSB), the frequency step (DI), scaling in bins per microvolt (SB), a scaling value for the BESA Research display (SC), and the number of channels (Nchan) as shown in the following example:
- Write the data in Multiplexed format: Line 1 contains the frequency step size in Hz. Line 2 lists the channel labels. Each subsequent line contains amplitude/power values for all channels (in the sequence given in line 2) for one frequency.
Both vectorized and multiplexed files may be reread into BESA Research in the same way as time-domain averages. Vectorized files may be read directly using the File / Open menu. Multiplexed files may be read using the ASCII import menu item File / Import ASCII file.
For each of these output formats and montages, different data can be saved:
- Amplitude Spectrum (Alt+F FA),
- Power Spectrum (Alt+F FP), or
- Real + Imaginary Part (Alt+F FR). In this case, amplitudes of the real and imaginary components are written to two separate files.
DOS file name extensions for each type of output file are given in the following table:
Exporting band amplitudes and power
Select Export Power in Bands (Alt+F P) or Export Amplitude in Bands (Alt+F A). An ASCII file is produced with one channel per line, and each line contains the value for each frequency band.
Sending FFT data to MATLAB
Select Send to MATLAB (Alt+F M) to transfer the current FFT data to MATLAB. This menu entry is available only when MATLAB is installed. Details on the MATLAB interface are provided in Help Chapter “MATLAB”.
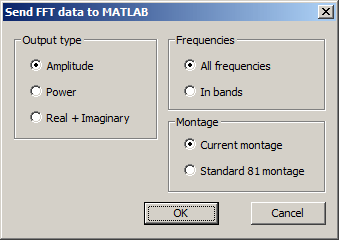
A dialog window opens that allows to specify:
- the type of data to be transferred (Amplitude, Power, or Complex FFT data)
- whether each frequency bin should be transferred or frequencies should be pooled in bands
- the montage for which the FFT should be sent
When hitting OK, the sent data will be made available in MATLAB in struct variable besa_fft. For details on the data transfer from BESA Research to MATLAB, please refer to Help Chapter “The MATLAB interface”.
Printing results of the FFT
Select File / Print to print the FFT display and FFT maps. BESA Research uses the standard WINDOWS printer output. You may change your printer settings temporarily for your current BESA Research session. In the printer setup, you can choose the orientation (landscape or portrait) and the resolution. If you have any problems with printing, try to set the resolution to 300*300. If you want to change the printer setup permanently, please select the Printer Control from the WINDOWS main control group.
A preview of the printout can be generated with File / Print Preview. Click on the 'OK' button to return to the program.
Closing FFT
To remove the FFT window (without saving the results), select Close in the File menu (Alt+F C), or simply type the <Esc> key.
FFT ‘Options’ Menu
The Options menu allows to define FFT mapping options, to set colors for the display of each frequency band, and to define and name up to 7 bands. When working with BESA Research, the band colors, names, and frequency ranges of the last session are stored in the file BESA.set. These values are then used in the next BESA Research session.
Mapping options
In the Mapping submenu two entries toggle different mapping modes:
- The entry 3D Whole Head Mapping toggles between 3D and 2D mapping.
- The entry Top Meridian Projection toggles between top meridian projection and whole head mapping.
Defining band colors
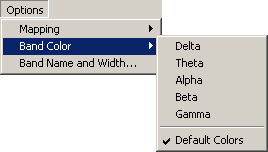
Select Options / Band Color (Alt+O C), and then the name of the band to define (e.g. Theta: Alt+O CT). A window is presented with a palette of colors, allowing the choice of a color for the display.
Select Default Colors (Alt+O CD) to select the default colors for the bands (predefined in BESA.ini).
Defining band names and widths
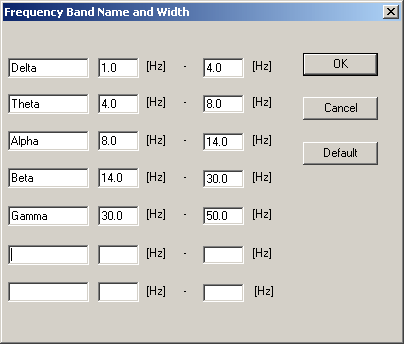
Select Options / Band Name and Width to define up to 7 band names and frequency ranges. A window showing names and frequency limits is displayed, allowing redefinition of the frequency bands. Overlapping frequency ranges can be defined. Upper/lower limits of FFT bands can be set up to the maximum frequency that can be displayed in the current FFT (which is usually half of the sampling rate). Press the Default button to select the default definitions as predefined in the file BESA.ini and shown in the following table:
FFT Mouse Controls
Single left click* on the displayed peak frequency or peak amplitude values of a channel or on the channel labels or head symbols at the left of the FFT window: Sets a cursor at the peak (dominant) frequency of the selected channel and displays a map of the topography at the marked frequency (only if the channel is not defined as bad).
- on the string indicating the spectrum type (Amp. Spectrum or Power Spectrum): Toggles between display of amplitude and power spectrum.
- on the string indicating the map type (EEG or MEG): Toggles between EEG and MEG FFT maps (only for combined MEG and EEG measurements).
- on the displayed spectrum: Sets a cursor and draws a FFT map of the topography at the marked frequency. The availability of this function by single left mouse click depends on the settings in the main window’s Options / Mapping submenu (Options / Mapping / Enable Direct Mapping by Single Click).
Note: The mouse pointer changes to a hand in areas of the FFT window where left mouse clicks initiate an action.
Double left click
- on the displayed spectrum: Sets a cursor and draws a map of the topography at the marked frequency. The availability of this function by single left mouse click depends on the settings in the main window’s Options / Mapping submenu (Options / Mapping / Enable Direct Mapping by Double Click).
Right click
- on the displayed spectrum: Opens an info-box indicating channel name, frequency, and amplitude/power at that frequency.
Density Spectral Arrays (DSA)
Introduction
The Density Spectral Arrays (DSA) module displays a compressed two-dimensional time-frequency display of the activity in the data file. It focuses on the frequency range of 1 Hz - 25 Hz which includes the commonly observed oscillatory rhythms in the human brain. This allows for a quick overview of the sections where events of interest occur, e.g. in the analysis of epileptic seizures or in sleep research. DSA values are computed for every second in the data file using a windowed FFT with a window length of 2s. By default, the DSA module uses a standardized brain source montage to separate the activities of both hemispheres and the different brain regions using 15 regional sources. This spatial filtering prior to the application of the time-frequency transformation helps to identify brain regions where oscillatory activity originates. The DSA can be invoked by hitting the ![]() button or from the Process menu.
button or from the Process menu.
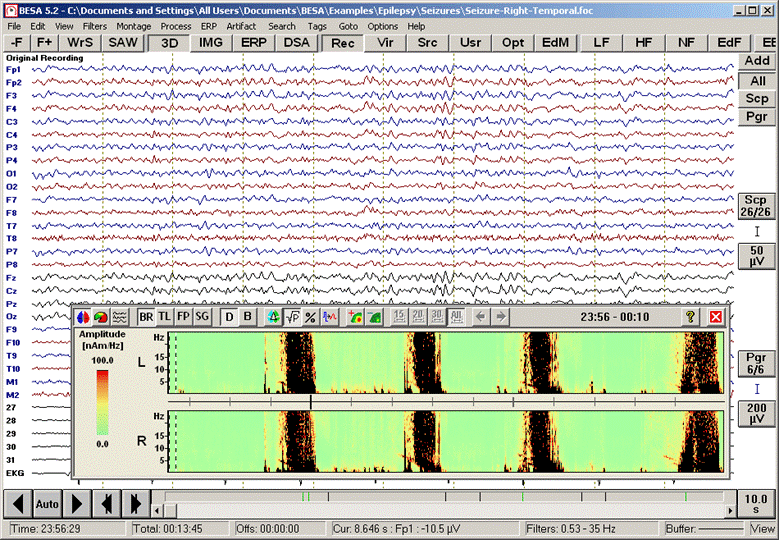
Standard DSA display of an EEG containing four seizures. For each brain hemisphere, the sum of activities is shown.
Using DSA to navigate
With a left mouse click into the DSA display, you can navigate to the selected EEG event. The data review window display jumps to the selected time in the record.
DSA display modes
Three modes of DSA display are possible:
- Hemispheric Comparison, which sums up all the lateral activities of each hemisphere
- Regional Comparison, which gives account of the activity within five gross brain regions
- Current Montage, which shows the activity in each channel of the selected montage at the time the DSA window was opened. For MEG data, only the Current Montage option is available.
For the first two modes, the signals are first transformed to the standardized brain source montage BR_Brain Regions (see chapter "Review / Remontaging") before the summation of the spectral parameters is performed. This transformation of the data to a source montage optimally separates the activities from the different brain regions that generate overlapping signals at the scalp surface. DSA of scalp channels can be seen by selecting a recording (traditional) montage and selecting mode 3, current montage.
The way in which signals are sub-sampled to obtain the density display can be modified, from the fastest sub-sampling to an averaged or maximum signal display. The color-coded display of the spectral values in frequency bins can be normalized to the percentage value relative to the sum over all frequency bins of each channel.
The current position in the data file is indicated by the vertical dashed lines in the display.
The time scale shows minutes as small gray ticks (in real time - not time measured from file start). In the "Hemispheric Comparison" mode, the time scale appears in the middle, whereas it is displayed below the channels otherwise. Thicker gray ticks indicate five-minute marks, larger black ticks ten-minute-marks, and segment borders are displayed in red.
Setting the DSA Display Mode
The data can be remontaged for display in three different ways using the first three toolbar buttons.
![]() Hemispheric Comparison (default option)
Hemispheric Comparison (default option)
Hemispheric comparison is activated by clicking on the leftmost toolbar button. The integrated activity of each hemisphere is shown. In this mode, the DSA window aligns with the event bar at the bottom of the main window to relate activity to the events marked in the event bar. The integrated activity of each hemisphere is calculated by first transforming the data to the standardized source montage BR_Brain Regions, which is also available from the "Src" button in the BESA Research main window (see chapter "Review / Remontaging"). Then the signals of all source channels in the left (L) and the right (R) hemispheres are summed up separately. This transformation of the data to a source montage optimally separates the activities from the different brain regions that are overlapped and smeared at the scalp surface.
For MEG data, this option is not available.
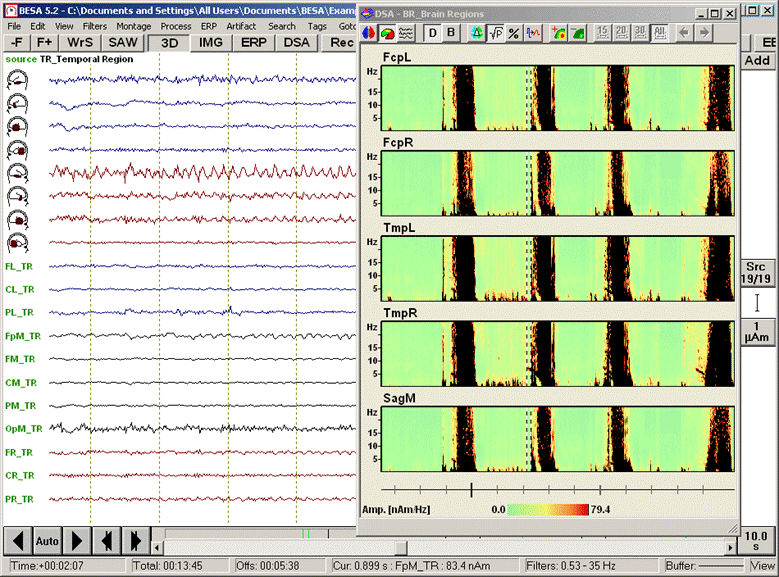
This option is activated by clicking on the second toolbar button. The integrated activity of five brain regions is shown. The regions are:
- FcpL, FcpR, which sum all lateralized activity in the upper parts of the brain
- TmpL, TmpR, which sum all activity in the temporal regions of the brain
- SagM, which sum all activity in the sagittal midline regions of the brain (only shown if tick mark "Midline Channels" is on in Montage Options).
In this mode, the DSA window is displayed in the right portion of the BESA Research main window. The integrated activity of each region is calculated by first transforming the data to the standardized source montage BR_Brain Regions, which is also available from the "Src" button in the BESA Research main window (see chapter "Review / Remontaging").
Then the signals of the source channels which belong to the corresponding region are summed up.
For MEG data, this option is not available.
With the third toolbar button, the Current Montage option is selected to display the spectra of the channels of the montage that was selected when the DSA window was opened. In this mode, the DSA window is displayed in the right portion of the BESA Research main window. If the current montage is changed in the BESA Research main window, the DSA display remains unchanged - Ändern.
The four following buttons, which appear only in the hemispheric comparison window, allow for the selection of the montage underlying the display, based on the source montage BR_Brain Regions. One of the buttons is always down, with BR as default.
In the case of BR (Brain Regions), the averages of all left-hand and right-hand side channels of the montage BR_Brain Regions are shown in the upper and lower channel, respectively, as indicated by the labels L and R.
For TL (Temporal Lobe), the averages of the most important channels of the source montage TR_Temporal Regions are calculated and displayed in the upper and lower channels labelled L and R. The channels in question are TAL and TPL for the left-hand side and TAR and TPR for the right-hand side.
FP (Frontoparietal) is based on the source montage BR_Brain Regions and averages the source channels FL, CL, PL and FR, CR, PR, respectively, displaying them in channels L and R.
SG (Sagittal) also uses the source montage BR_Brain Regions. The mean of the frontal sagittal channels FpM, FM and CM is displayed in the upper channel F, the mean of the posterior sagittal channels CM, OpM and CM is shown in the lower channel P.
Many features of interest are lateralized in the brain and show up clearly when hemispheric regions are compared directly. This is achieved using the Delta toolbar button:
This button enables subtraction of hemispherically homologue regions and is available for the standardized montage options "Hemispheric Comparison" and "Regional Comparison".
Hemispheric Difference
Regional Difference
The epoch buttons allow the choice of time interval for browsing through the data. Either the whole file ("All") or intervals of 15, 20 or 30 minutes, with one additional minute of overlap with the following window, are shown. The default is 20 minutes, which corresponds best to the length of the standard EEG. For continuous data files, interval start times are chosen in relation to the full hour (e.g. 18:00, 18:20 and 18:40 for the 20-minute window). Only the first and last window are positioned such as to start and end with file start and end, respectively.
The default epoch is "All" for files shorter than 20 minutes and "20" for longer files. For files no longer than 15 minutes, all buttons are grayed (with "All" automatically selected). Otherwise, "All" and those buttons which allow paging are enabled.
In the case of "All" and files of long duration, a progress bar may appear. Hitting "Abort" will result in the display of those portions of the data that have already been calculated.
The epoch buttons are grayed in the zoom mode.
Page backward / forward one interval of the currently selected length. The page buttons are enabled only if the position in the file, and the file length, allow to browse to an earlier / later interval.
The page buttons are grayed in the zoom mode.
Display Options
To emphasize features of interest, the DSA display can be optimized to normalize and scale the spectral data in different ways.
The status of the percentage button on the toolbar determines how the color-coded display of the intensity values in frequency bins is normalized. The options are:
Absolute Value (button is up):
Percentage (default option, button is down)
The effect when applying the percentage normalization to data is shown in the example below, where hemispheric difference with and without percentage normalization is shown:
Hemispheric difference display without percentage normalization (top) and with percentage normalization (bottom). The decreasing 9 to 7-Hz seizure activity in the right hemisphere emerges better from the background with percentage normalization.
The amplitude button toggles between display of amplitude and power. The default setting is on amplitude (button is pressed).
If amplitude is selected, displayed intensities are in µV/Hz, fT/Hz, fT/(cmHz), or nAm/Hz.
If power is selected, displayed intensities are in µV²/Hz, fT²/Hz, fT²/(cm²Hz), or nAm²/Hz.
![]() ] Original Data and Baseline Normalization
] Original Data and Baseline Normalization
By default, the original data are shown (button D down). If option B (baseline normalization) is chosen, amplitude/power for each sampling time and frequency and each remontaged channel is normalized by the sum over all sampling times for the given frequency.
This can sometimes help to suppress or intermittent or continuous signals of constant frequency.
Hemispheric comparison display without (top) and with (bottom) additional baseline normalization, which enhances the contrast between seizures and background for this example.
![]() ] Setting the Display Sampling
] Setting the Display Sampling
Since the data file features far more sampling times than pixels available for DSA display, a sub-sampling is required to compress data file sections into the pixels shown in the DSA. The method how this is achieved can be chosen with the sampling popup menu. Using the sampling button in the toolbar, the type of sampling of data for the display can be chosen.
Three options are possible:
- Sub-sample Epochs:
- Average Epochs (default option):
- Select Maximum:
The left button (+) scales intensities up, the right one (-) scales them down. Each time one of the buttons is pressed, scaling is increased/decreased by a factor of ³√2. This means that pressing the same button 3 times results in doubling / halving the normalization intensity.
Zooming the Display
You can use the left mouse button to drag a rectangle anywhere in the display. A popup menu containing the entries "Zoom In" and "Zoom Out" appears, from which you can choose to zoom into the selected area. In the zoom mode, the epoch and page buttons are up and grayed.
![]() ] Zooming out can be done using the Zoom Out button, which is shown only if the display is zoomed. The display then returns to the former view. Otherwise, dragging another rectangle reopens the popup menu.
] Zooming out can be done using the Zoom Out button, which is shown only if the display is zoomed. The display then returns to the former view. Otherwise, dragging another rectangle reopens the popup menu.
Note: for further details on Spectral Analysis (FFT and DSA) in BESA Research, please refer to the Help Chapter ‘Spectral Analysis’.
Tutorial
This tutorial will introduce the main features of the DSA module. A detailed description of all features can be found in the reference section.
The tutorial uses a data file with four concatenated EEG segments of epileptic seizure data (by courtesy of Prof. J. Ebersole, U Chicago). We will learn how to identify events in the data file quickly using the DSA display and how to find epochs with prominent rhythmic activities that differ between hemispheres.
1. Use the File / Open menu to browse to the folder Examples\Epilepsy\Seizures. Select the data file 'Seizure-Right-Temporal.foc' and open it. The data are shown in the originally recorded montage. By default, a time constant of 0.3 sec (i.e. Low Filter: 0.53 Hz) is enabled (unless you changed the settings in your .ini file).
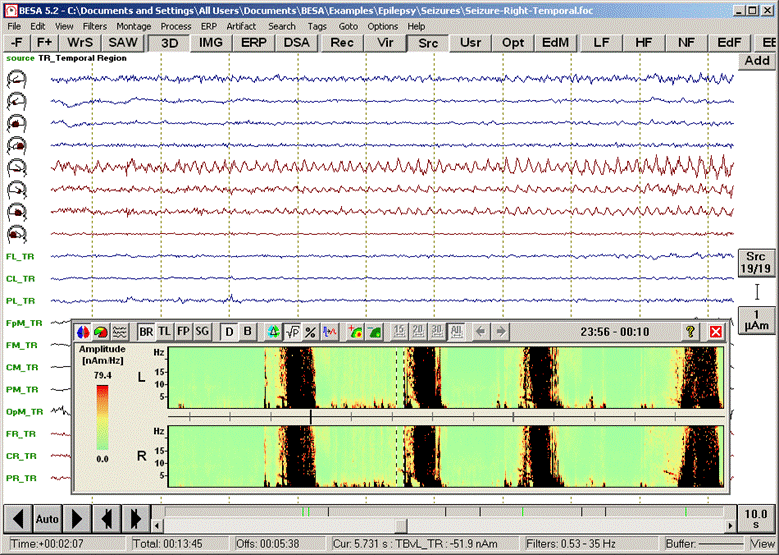
2. In the main window, press pushbutton ''Src' and select the source montage 'TR_Temporal Region. This displays the left and right temporal lobe channels in the top 8 traces and reveals strongly lateralized right temporo-basal seizure activity. Press the high filter pushbutton HF and select 35 Hz to reduce the EMG artifact.
3. Press the push button "DSA" at the top of the main window. The DSA window opens. In the DSA display, the horizontal axis represents time, whereas the vertical axis represents frequency (from 1 to 25 Hz).
With the Amplitude button ![]() ] down, and the Percentage button
] down, and the Percentage button ![]() ] released, the following image is obtained:
] released, the following image is obtained:
Four seizures can be distinguished in the display (red blocks of large EEG activity). Only two source channels, L and R, are shown, one for each hemisphere. These channels are obtained by calculating the mean left and right source activities using the 5 left and 5 right regional sources of brain source montage BR_BrainRegions to reduce overlap by volume conduction.
4. Scale the DSA display up using the Scaling button in the toolbar (![]() ). Pressing it three times decreases the threshold for maximum intensity by a factor of 2. The color map caption text changes correspondingly. Scale the display down again, either using the next toolbar button, or the 'Cursor-Down' key on the keyboard to set the amplitude scale to 79.4 nAm. This will reveal the dark 'nose-tips' at the beginning of the second and fourth seizure with frequencies decreasing from about 8 to 5 Hz and obvious lateralization to the right hemisphere.
). Pressing it three times decreases the threshold for maximum intensity by a factor of 2. The color map caption text changes correspondingly. Scale the display down again, either using the next toolbar button, or the 'Cursor-Down' key on the keyboard to set the amplitude scale to 79.4 nAm. This will reveal the dark 'nose-tips' at the beginning of the second and fourth seizure with frequencies decreasing from about 8 to 5 Hz and obvious lateralization to the right hemisphere.
5. Move the mouse cursor over the data display. Current time and frequency are shown below the color bar and next to the mouse cursor, respectively. Click on the red-nose tip (~6.5 Hz) around +00:02:09 (12:02:09 AM) in the right source channel (R) to move the EEG display to this epoch at the beginning of the second seizure. A comparison of the traces of the left (traces 1-4) and right (traces 5-8) temporal lobe sources (Src/TR_Temporal Region) confirms the lateralization of the seizure onset to the right hemisphere.
6. Press the second-left toolbar button (![]() ) to switch to the display mode 'Regional Comparison'. The DSA display moves to the right of the main window and displays the spectral densities of five regions by summarizing the activities in the lateralized upper parts of the brain, in the temporal regions bilaterally, and in the midline regions.
) to switch to the display mode 'Regional Comparison'. The DSA display moves to the right of the main window and displays the spectral densities of five regions by summarizing the activities in the lateralized upper parts of the brain, in the temporal regions bilaterally, and in the midline regions.
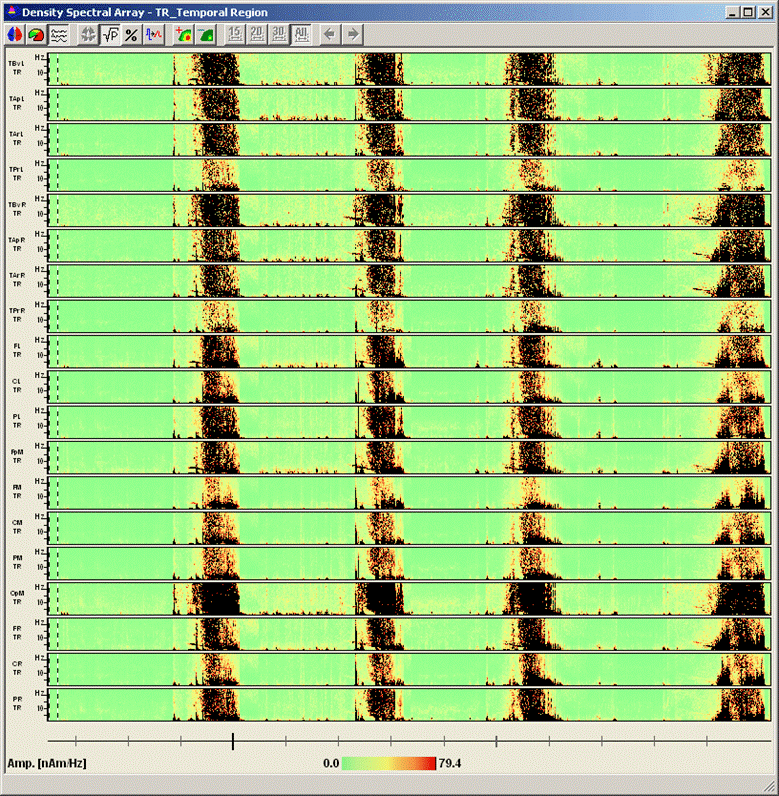
7. Press the third toolbar button (![]() ) to switch to the display mode 'Current Montage'. The DSA display on the right of the main window now displays the spectral densities of all channels in the current montage. Enlarge the DSA window by using the full-screen symbol at the top right. It is very apparent now that the seizures start with an interval of increased activity in the 8-5 Hz range. This activity is most noticeable in the anterior three source channels of the right temporal lobe (TBvr_TR, TApr_TR, and TArR_TR).
) to switch to the display mode 'Current Montage'. The DSA display on the right of the main window now displays the spectral densities of all channels in the current montage. Enlarge the DSA window by using the full-screen symbol at the top right. It is very apparent now that the seizures start with an interval of increased activity in the 8-5 Hz range. This activity is most noticeable in the anterior three source channels of the right temporal lobe (TBvr_TR, TApr_TR, and TArR_TR).
8. Use the overlapping window icon at the top right of the window to get the window back to its original position at the right of the screen. Then press the Sampling toolbar button ( ![]() ) to select the menu entry 'Select Maximum' from the dropdown menu which appears. This results in pronouncing maxima of intensities: for each frequency bin, the maximum over the epoch that is related to one pixel of the display is computed. In this case, the noise is enhanced by the procedure. Press the button again to go back to 'Average Epochs', which displays the average over the epoch related to one displayed pixel for each frequency bin.
) to select the menu entry 'Select Maximum' from the dropdown menu which appears. This results in pronouncing maxima of intensities: for each frequency bin, the maximum over the epoch that is related to one pixel of the display is computed. In this case, the noise is enhanced by the procedure. Press the button again to go back to 'Average Epochs', which displays the average over the epoch related to one displayed pixel for each frequency bin.
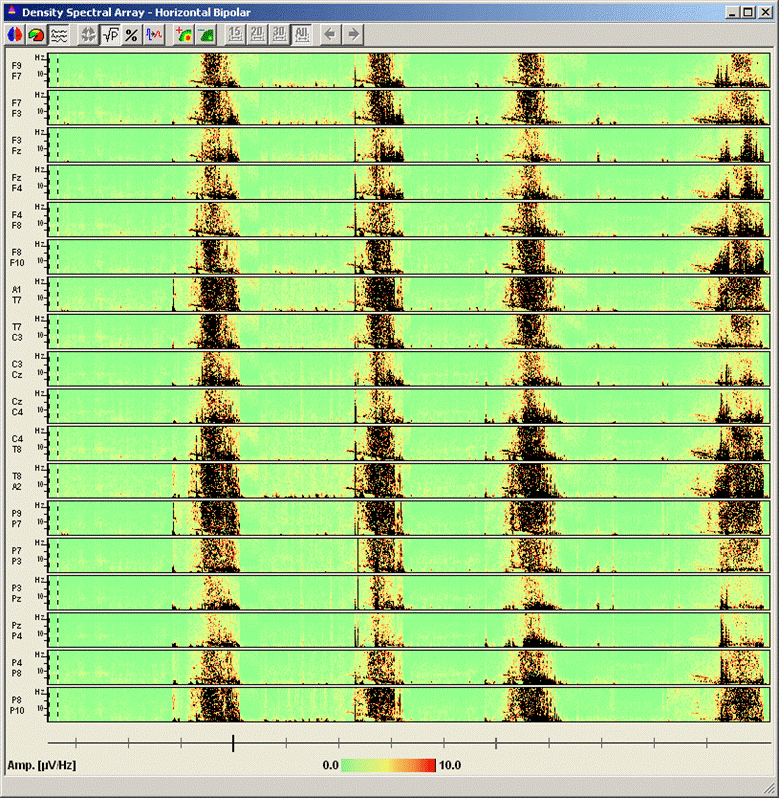
9. Close the DSA window using the close symbol at the top right. Press pushbutton 'Vir' to select the virtual Horizontal Bipolar montage. Press the pushbutton DSA to recalculate DSA for the new current montage, then press the Amplitude button ( ![]() ) and the third toolbar button (
) and the third toolbar button (![]() ). You can now see that the scalp montage, although optimized for temporal-basal activity shows a poor separation between hemispheres.
). You can now see that the scalp montage, although optimized for temporal-basal activity shows a poor separation between hemispheres.
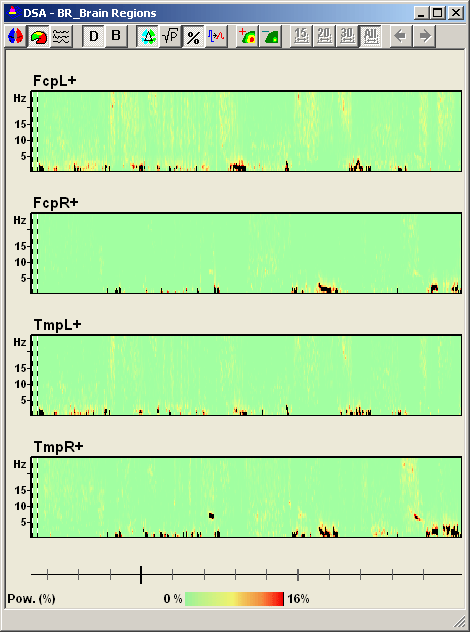
10. Press the second-left toolbar button ( ![]() ) to select the menu entry 'Regional Comparison'. Press the 'Delta' button (
) to select the menu entry 'Regional Comparison'. Press the 'Delta' button ( ![]() ) to switch to regional difference. The channels now show the difference between activities in the homologous brain regions. Then press the Display button (
) to switch to regional difference. The channels now show the difference between activities in the homologous brain regions. Then press the Display button (![]() ) to switch to the display mode 'Percentage'. Now, the relative spectral amplitude in each frequency bin and time point is displayed. Switch to displaying spectral power by releasing the Power button (
) to switch to the display mode 'Percentage'. Now, the relative spectral amplitude in each frequency bin and time point is displayed. Switch to displaying spectral power by releasing the Power button ( ![]() ). Adjust the scaling to 16% at maximum intensity using the scaling toolbar buttons or the cursor up-down keys.
). Adjust the scaling to 16% at maximum intensity using the scaling toolbar buttons or the cursor up-down keys.
This display mode takes away most of the unwanted activity which is not lateralized, and clearly shows the dark clusters in the right hemisphere in the 7 Hz range immediately before the second and fourth seizure.
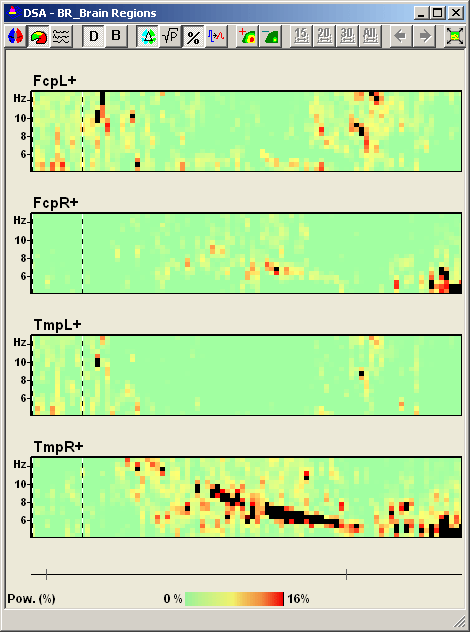
11. Use the left mouse button to drag a rectangle around the beginning of the fourth seizure in channel "TmpR+". From the popup menu that appears, select "Zoom In". The display is zoomed to show just the selected area. The seizure onset of the 4th seizure is visible as a decelerating 7Hz oscillation in the right temporal region. Use the right mouse button to zoom out again.
This concludes the tutorial on density spectral arrays. It gave a brief introduction into the ways in which the DSA can be used in combination with traditional and brain source montages, and demonstrated its abilities to quickly identify epochs and regions of interest in EEG data files.
