Difference between revisions of "Export Connectivity Results"
| Line 79: | Line 79: | ||
[[File:BESA_Connectivity_Data_Blocks.png]] | [[File:BESA_Connectivity_Data_Blocks.png]] | ||
| − | The columns of each data block indicate the latencies, starting with the earliest latency (first column) up to the latest latency (last column). | + | The columns of each data block indicate the latencies, starting with the earliest latency (first column) up to the latest latency (last column). There should be as many columns in each data block as specified in the header by the value of the ''NumberTimeSamples'' key. The rows of each data block indicate the frequencies, starting with the lowest frequency (first row) up to the maximum frequency (last row). There should be as many rows in each data block as specified in the header by the value of the ''NumberFrequencies'' key. |
[[Category:Connectivity]] | [[Category:Connectivity]] | ||
Revision as of 21:35, 12 October 2020
| Module information | |
| Modules | BESA Connectivity |
| Version | 1.0 or higher (BC) |
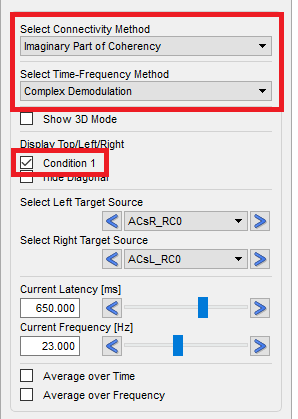
BESA Connectivity provides export of connectivity results via the menu entry Export → Export Results → Export Connectivity Data. This option will export the entire connectivity matrix (for all latencies and frequencies) of the currently selected connectivity method, time-frequency decomposition method and condition.
The connectivity matrix is written in a simple ASCII file that can be opened and edited with a text editor (e.g.: Notepad, Notepad++). The extension .conn will be added. The first line of the connectivity results file format is a comma-separated list of information on the expoted data. It contains the following key - value pairs:
| Key | Value | Description |
|---|---|---|
| VersionNumber | 1.0 | File format version |
| DataType | Coherence / Granger Causality, etc. | Connectivity method |
| DecompositionType | Complex Demodulation / Wavelet Transform | Time-frequency method |
| ConditionName | Stimulus condition | Name of condition |
| NumberTrials | 12 | Number of trials |
| NumberTimeSamples | 120 | Number of latencies |
| TimeStartInMS | -400.0000 | Start latency in [ms] |
| IntervalInMS | 50.0000 | Latency spacing in [ms] |
| NumberFrequencies | 31 | Number of frequencies |
| FreqStartInHz | 2.000 | Start frequency in [Hz] |
| FreqIntervalInHz | 1.000 | Frequency spacing in [Hz] |
| NumberChannels | 64 | Number of channels/sources |
The second line defines the channel/source labels. Please note that the list is comma-separated, therefore the list of labels must not contain spaces!
Example header
VersionNumber=1.0 DataType=Coherence DecompositionType=Complex Demodulation ConditionName=Condition 1 NumberTrials=10 NumberTimeSamples=33 TimeStartInMS=-400.0000 IntervalInMS=50.0000 NumberFrequencies=31 FreqStartInHz=2.0000 FreqIntervalInHz=1.0000 NumberChannels=3
ACsR_RC0 ACsL_RC0 PrM_RC0
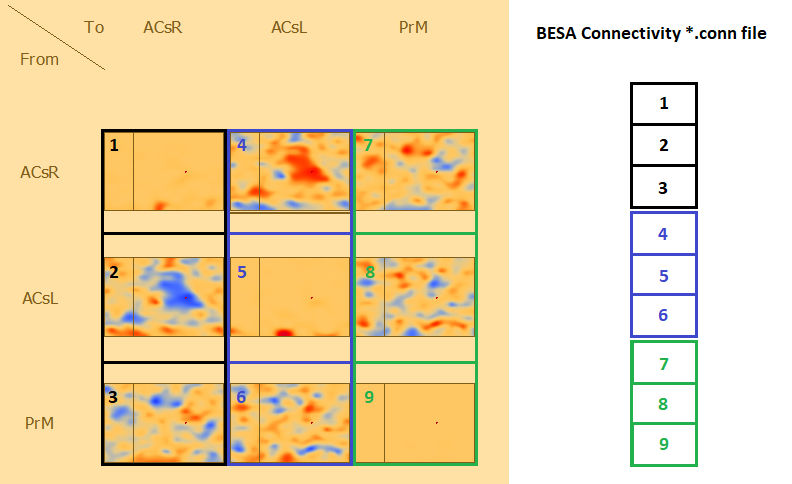
After the file header, the connectivity data is exported column-wise as indicated in the following image:
The columns of each data block indicate the latencies, starting with the earliest latency (first column) up to the latest latency (last column). There should be as many columns in each data block as specified in the header by the value of the NumberTimeSamples key. The rows of each data block indicate the frequencies, starting with the lowest frequency (first row) up to the maximum frequency (last row). There should be as many rows in each data block as specified in the header by the value of the NumberFrequencies key.

