Difference between revisions of "Peak Finder explained"
(→Peak finding with a marked interval) |
|||
| Line 9: | Line 9: | ||
== ERP module: interactive peak finding == | == ERP module: interactive peak finding == | ||
| + | After entering the Top Viewer, the Peak Finder can be invoked in three ways: | ||
| + | # By marking a data block, and using the right-click popup menu | ||
| + | # By right-clicking on a channel with only a cursor position marked, or nothing marked | ||
| + | # By using the menu entry. This will open the Peak Finder dialog, but not search for peaks yet. | ||
=== Peak finding with a marked interval === | === Peak finding with a marked interval === | ||
| − | |||
| − | |||
| − | |||
This is what it looks like after marking a block and right-clicking: | This is what it looks like after marking a block and right-clicking: | ||
| − | [[File: | + | [[File:PeakFinder1a.png]] |
| + | |||
| + | The program automatically found the highest negative and the highest positive peak within the interval.The mean amplitude is calculated over the whole interval. In this case, positive and negative amplitudes almost cancel out. The peak label is chosen on the latency that has the highest overall amplitude. By default, other channels' amplitudes are calculated at the latencies of the search channel's positive and negative peaks (to change this, un-check the check box "All Amplitudes at Same Latency" - then, the search will run independently for each channel). | ||
| + | The area is the cumulative positive and negative amplitude over the whole interval, as indicated below. | ||
| + | |||
| + | [[File:PeakFinder2.png]] | ||
| + | |||
| + | === Peak finding after setting a cursor === | ||
| + | The result of peak finding after setting a cursor (or using the mouse position) is shown below: | ||
| + | |||
| + | [[File:PeakFinder3.png]] | ||
| + | |||
| + | In this scenario, the first peak is found by checking which relative maximum or minimum is closest to the cursor position (or mouse position). This will become the main peak (here, it is the positive peak). | ||
| + | |||
| + | [[File:PeakFinder4.png]] | ||
| + | Then, a search starts in both directions for a local minimum or maximum - in this scenario, the negative peak is searched for. Here, the next negative peak is to the right of the main peak: | ||
| + | [[File:PeakFinder5.png]] | ||
Revision as of 11:47, 2 February 2021
| Module information | |
| Modules | BESA Research Basic or higher |
| Version | 6.1 or higher |
Contents
Introduction
This article will explain how the Peak Finders in the BESA ERP module and in the Combine Conditions work, and how the different values are computed.
ERP module: interactive peak finding
After entering the Top Viewer, the Peak Finder can be invoked in three ways:
- By marking a data block, and using the right-click popup menu
- By right-clicking on a channel with only a cursor position marked, or nothing marked
- By using the menu entry. This will open the Peak Finder dialog, but not search for peaks yet.
Peak finding with a marked interval
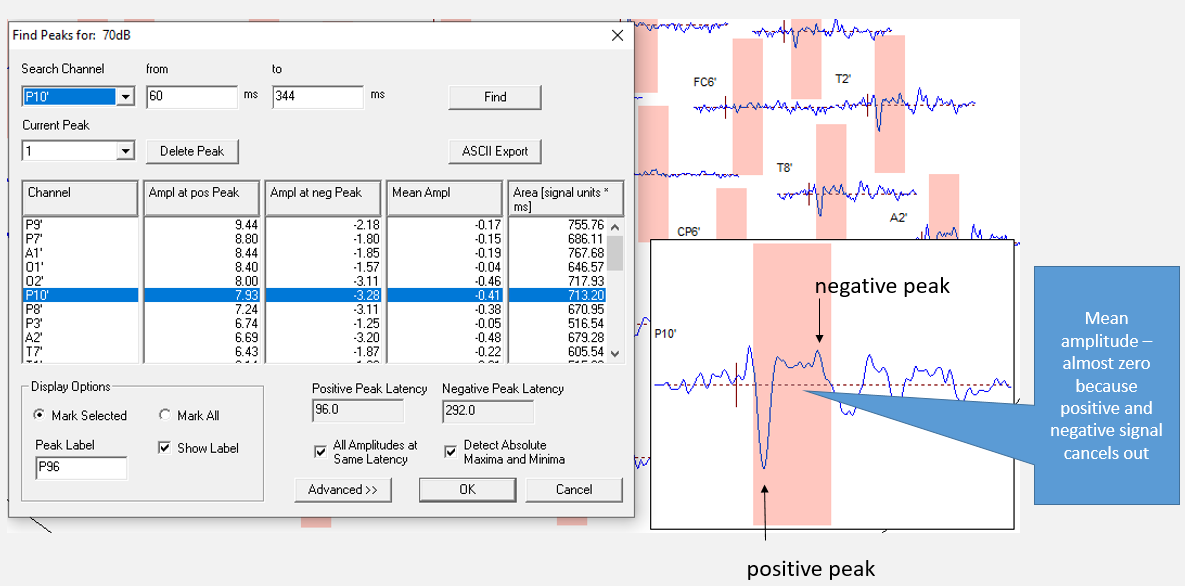
This is what it looks like after marking a block and right-clicking:
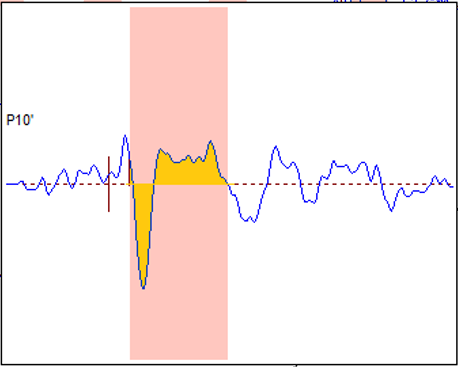
The program automatically found the highest negative and the highest positive peak within the interval.The mean amplitude is calculated over the whole interval. In this case, positive and negative amplitudes almost cancel out. The peak label is chosen on the latency that has the highest overall amplitude. By default, other channels' amplitudes are calculated at the latencies of the search channel's positive and negative peaks (to change this, un-check the check box "All Amplitudes at Same Latency" - then, the search will run independently for each channel). The area is the cumulative positive and negative amplitude over the whole interval, as indicated below.
Peak finding after setting a cursor
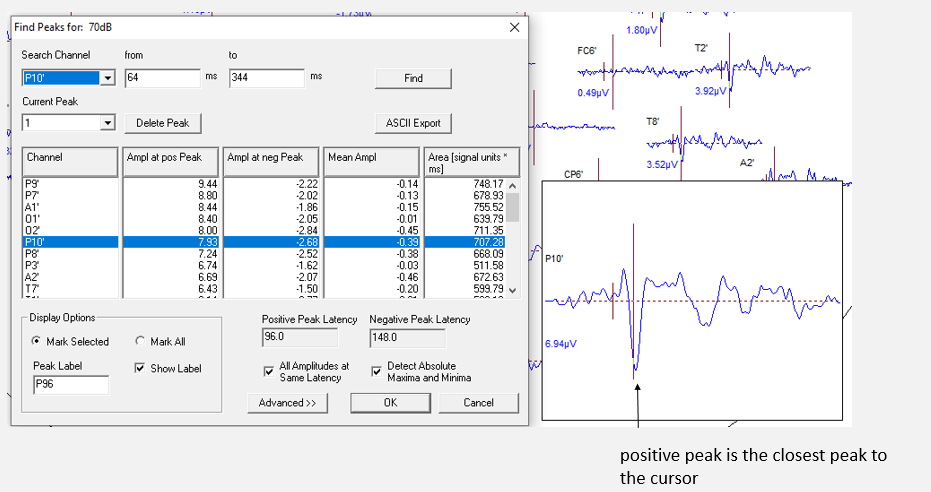
The result of peak finding after setting a cursor (or using the mouse position) is shown below:
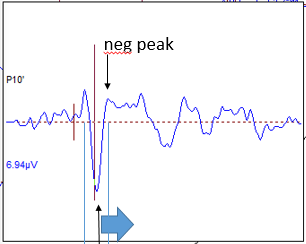
In this scenario, the first peak is found by checking which relative maximum or minimum is closest to the cursor position (or mouse position). This will become the main peak (here, it is the positive peak).
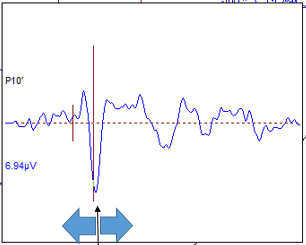 Then, a search starts in both directions for a local minimum or maximum - in this scenario, the negative peak is searched for. Here, the next negative peak is to the right of the main peak:
