Source Analysis Functions of the Window
Contents
Functions of the Source Analysis Window
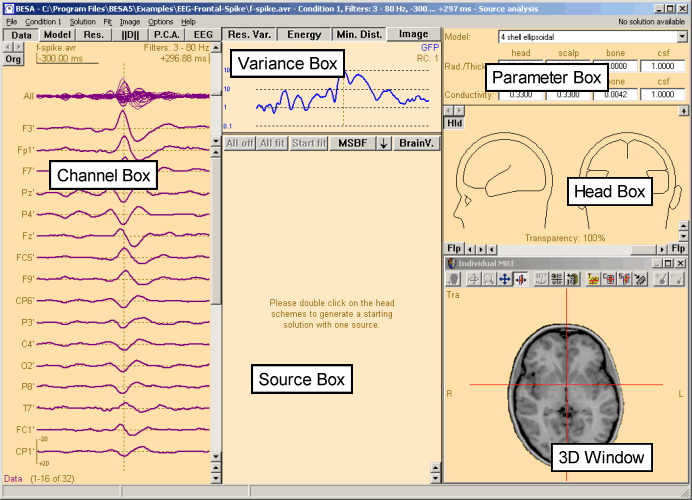
The Source Analysis module window is subdivided into six main parts (boxes) which will be explained briefly in the following sections:* The Channel Box (left)
- The Variance Box (top center)
- The Source Box (bottom center)
- The Parameter Box (top right)
- The Head Box (mid right)
- The 3D Window (bottom right)
Note that the 3D window will not normally appear automatically (unless specified in the Options/Preferences menu), and the head box will take up more space if the 3D window is not displayed.
(Click on the region of interest to jump to the associated section. Use the Back button of the Windows® help to jump back to this page.)
The title bar contains information about the data file, the filename, the condition name, the filter settings, and the selected time interval.
Most of the functions and commands can be chosen from the main menu bar below the title bar. However, all important commands are also available via a right mouse click. Whenever you right-click, a context-sensitive popup menu will appear containing the available commands.
A detailed description of the commands of the menu bar and the different popup menus is given in the online help Reference chapter.
At the bottom, you will notice the status bar, which gives information about the current mouse position (latency or 3D position) and the current cursor location or the fit interval(s). (See the section on the status bar in the online help Reference chapter).
The individual size of the boxes can be modified: Try placing the mouse over the vertical double line that separates the source box and the head box. The horizontal arrow that appears indicates that you can move this separator by dragging with the left mouse button.
The same is possible for the horizontal double line bounding the variance box.
Channel Box
The channel box normally shows the signals at each channel. The display depends on the state of the push buttons at the top of the channel box.
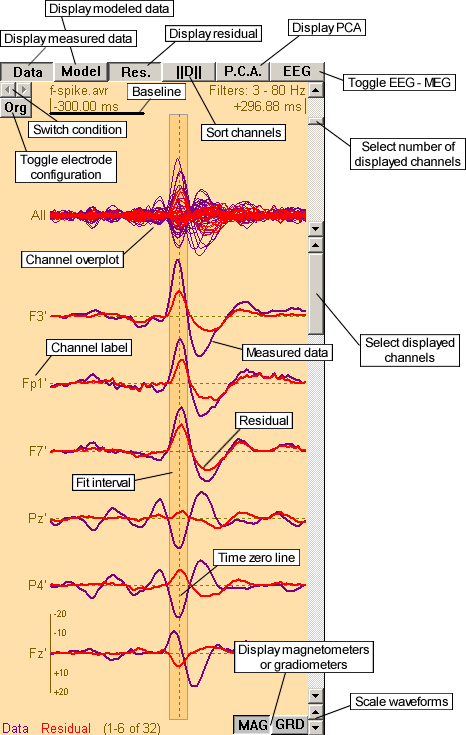
The figure below shows an example with the display of the measured data waveforms (violet) and the residual waveforms (red) at each channel. The channel labels are displayed to the left of each waveform.
An overplot of all waveforms is displayed above the single waveforms (labeled All).
(Click on the region of interest to view a description.)
Below the first row of buttons, there is a description of the current condition containing the condition name, the filter settings and the condition epoch. Below the condition epoch, the baseline of the current condition is displayed as horizontal black line.
At the bottom, you see the figure legend describing the used colors and the number of displayed channels (or PCA components).
The Channel buttons at the top of the channels box specify which waveforms are displayed.
- The Data button toggles the display of the data (measured signals) of the visible channels (violet waveforms). If you double click on this button the Model and Residual buttons are released and the channels are re-sorted by the amplitude of the measured data.
- Press the Model button to toggle the display of the modeled data (blue waveforms). The modeled data are calculated from the waveforms of the active sources in the current solution using the currently chosen head model. (The source waveforms are displayed in the source box, the head model is set and displayed in the parameter box.) Pressing the Model button toggles between the display of all active sources (button is labeled M-A) and the display of the model waveforms which result from the contributions of all sources whose Fit/No fit button is pressed (button is labeled M-F). Note that the Residual button is released if the Model button is pressed without holding the Control-key.
- Press the Residual button to toggle the residual (unexplained) signal (red waveforms), i.e. the difference between measured and modeled data. If you double click on this button the Data and Model buttons are released and the channels are re-sorted by the amplitude of the residual. Note that the Model button is released if the Residual button is pressed without holding the Control-key.
- The Sort button (fourth button from the left) changes the ordering of the channels. Pushing this button switches between original order (button is labeled Order or Ord.), sorting by the amplitude of the measured data (||Data|| or ||D||), and sorting by the amplitude of the residual (||Res.|| or ||R||). In practice, by using one of the sorting modes ||Data|| or ||Residual||, you will only have to display the first few channels during the fitting procedure, since the channels with the largest signals are shown at the top.
- Use the P.C.A. button to start a Principal Components Analysis (PCA) over the marked fit interval(s) (if no fit interval is set the PCA is computed over the whole epoch). The percentage variance accounted for by each component is shown at the left of each waveform. When the PCA is displayed, data, model, and residual waveforms are not visible. Note that if the Residual button is down and the Data button is up, the PCA is computed for the residual data and not the measured data.
- The button at the far right is the EEG/MEG button. Pushing this button toggles between the data sets (EEG and MEG) of the current condition, if combined EEG and MEG have been recorded. The label of the button shows which data set is currently displayed.
At the top left below the Data button, the Switch Condition buttons (labeled with two arrows) enable fast switching between different conditions. They are enabled only if at least two conditions have been loaded.
Below the Switch Condition buttons, the Toggle Electrode Configuration button toggles between using the original channels (button is labeled Org) or using an interpolated montage of 81 electrodes at standard locations (button is labeled Std). This montage allows comparison of different subjects at standard electrode locations. Note: If MEG channels are displayed this button is not available.
The channel box is bounded at the right by three scroll bars. Use the topmost one to change the number of displayed channels. The scroll bar below (select displayed channels) can be used to scroll through the channels. The bottom one, consisting only of two arrows, changes the amplitude scaling of the displayed signals (scale waveforms).
The MAG and GRD buttons at the bottom of the channel box appear only if an MEG data set containing both magnetometer and gradiometer sensors is displayed. The buttons are used to toggle the display of the magnetometer and gradiometer channels.
In the figure above you see one fit interval, shown in a darker color. The fit interval is used for fitting, computing the PCA, and more.
Using the Mouse
In the channel box, it is possible to set the cursor or a fit interval with the left mouse button. If you click on the text in the top left corner, you may change the condition name. By clicking on the baseline, a new baseline interval can be specified.
If you click the right mouse button somewhere in the channel box, the Channel Box popup menu appears with commands specific to this box.
Variance Box
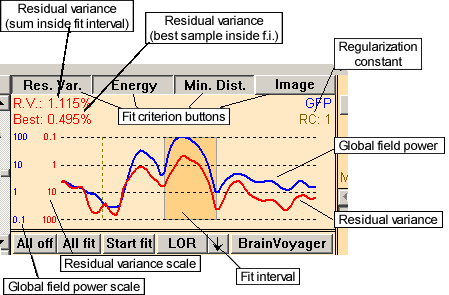
The variance box shows the global field power (blue) and the residual variance (red) in logarithmic scaling, relative to the maximum global field power. The global field power is the sum of squares of the activity over all channels of the current data set, the residual variance is the sum of squares of the unexplained signal. Note that the global field power is scaled from bottom to top, whereas the residual variance is scaled from top to bottom. The corresponding waveform scales at the left of the variance box are given in percent.
(Click on the region of interest to view a description or jump to the associated chapter.)
At the top left the residual variance (RV) over all samples inside the fit interval(s) is displayed (labeled R.V.). Below, the minimum residual variance inside the fit intervals (labeled Best) is shown. If no fit interval is selected, values for the whole epoch are given. If a cursor is set, the RV over the whole epoch and the value of the RV at the cursor sample are displayed (labeled Curs.).
At the top right, second row, you see the current value of the regularization constant, a parameter used to reduce the interaction between sources. (You can set the regularization constant with the Regularization Constant: X% menu entry in the Options menu or by clicking on the current value.)
The Fit Criterion buttons at the top of the variance box toggle the corresponding fit criteria on and off. Starting from the left the buttons represent the residual variance criterion, the energy criterion, the minimum distance criterion, and the residual variance - q value (S/N) criterion. You will find additional information in the section Fit Criterion Buttons in the online help Reference chapter.
Using the Mouse
In the variance box, it is possible to set the cursor or a fit interval with the left mouse button. If you click on the regularization constant (RC), you may set a new value.
If you click the right mouse button somewhere in the variance box, the Variance Box popup menu appears with commands specific to this box.
Source Box
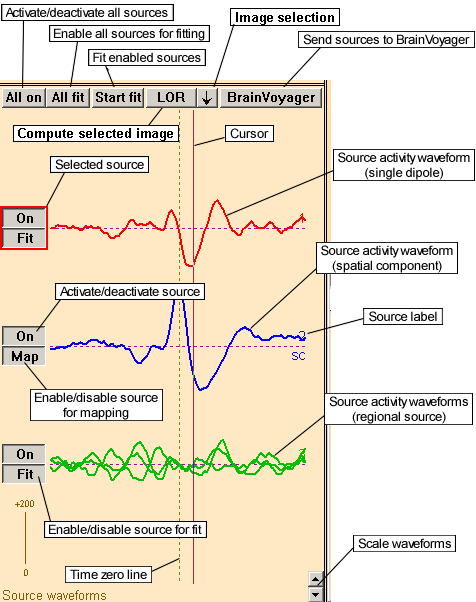
The source box shows the source waveforms of the current solution. The source waveforms are computed over the whole epoch of the current data set using the currently chosen head model. (The head model is set and displayed in the parameter box.) If no solution is available the source box is empty.
A single dipole or a spatial component has one source waveform, a regional source has three waveforms for EEG and two for MEG (one waveform for each component). A spatial component is labeled SC just below its waveform.
(Click on the region of interest to view a description.)
At the top of the source box you will find the following buttons:
- The All on button activates or deactivates all sources (switches all sources on or off). Spatial components whose principal vector does not match with the current data set cannot be activated.
- The All fit button enables all active sources (not spatial components) for fitting.
- The Start fit button fits the enabled sources within the specified fit interval(s). If no fit interval is set the sources the whole epoch is used for fitting, if a cursor is set they are fitted only at the cursor sample. Another way to start fitting is given by the Fit Enabled Sources... entry in the standard popup menu.
- The Image selection button allows for a quick computation of a 3D image. The type of the image to be computed is shown in the button label. By default, this is the previously computed 3D image. For details on the available image types in BESA Research, please refer to chapter 3D imaging.
- The BrainVoyager button will start the BrainVoyager program. If the BrainVoyager path has not been set correctly the BrainVoyager tab of the Preferences dialog box is displayed to allow you to set the valid path. If the BrainVoyager program is already running the current solution is sent to BrainVoyager for display in the structural MRT image (c.f. Integration with MRI/fMRI).
Each source waveform has two push buttons assigned to it:
- The On/Off buttons to the left of the source waveforms activate or deactivate the associated sources. Spatial components whose principal vector does not match with the current data set cannot be activated. If a source is inactive, it does not contribute to the model.
- The Fit/No fit buttons below the On/Off buttons enable or disable the associated source for fitting. If a source is selected, it is enabled for fitting automatically. On the other hand, a source is automatically selected if you push the corresponding Fit/No fit button. Note that spatial components have no Fit/No fit button since they cannot be enabled for fitting. You can enable several sources for fitting by keeping the Control-key on your keyboard pressed and pushing the Fit/No fit buttons of the sources you would like to fit simultaneously. If the model waveforms of fit enabled sources are displayed in the channel box (the Model button in the channel box shows M-F), or if the model data of fit enabled sources are mapped in the 3D window, only sources whose Fit/No fit button is down are taken into account for the waveform or map display. Otherwise the associated source will not contribute to the model waveforms or model map.
- The Map/No map buttons are visible only if the model waveforms of fit enabled sources are displayed in the channel box (the Model button in the channel box shows M-F) or if the model data of fit enabled sources are mapped in the 3D window. They are available for spatial components only, since other sources use the Fit/No fit buttons to enable/disable the source for mapping or to display the model waveforms. Only spatial components whose Map/No map button is down are taken into account in the waveform or map display. Otherwise the associated source will not contribute to the model waveforms or model map. You can enable several sources for mapping by keeping the Control-key on your keyboard pressed and pushing the Map/No map buttons (for spatial components) or Fit/No fit buttons (for other source types) of the sources you would like to contribute to the model waveforms or model map.
Use the Waveform Scale buttons (labeled with two arrows) at the bottom right of the source box to adjust the waveform amplitude scale. If you hold the Control-key in combination, the scale is reset to default.
Using the Mouse
Click on a source waveform if you want to select the associated source. The selected source is marked by a colored rectangle around its On/Off and Fit/No fit buttons.
If the current solution contains more than one sources you can change the source order by dragging the baseline of the source waveform up and down.
As in the Channel Box, you can set the cursor or a fit interval with the left mouse button.
You may double click on the source label to specify a new label.
If you click the right mouse button somewhere in the source box, the Source Box popup menu appears with commands specific to this box.
If you click the right mouse button on a source label or source number at the right-hand side of the source waveforms, the Source Label popup menu is displayed.
Parameter Box
The parameter box shows either the parameters of the current head model or of the selected source.
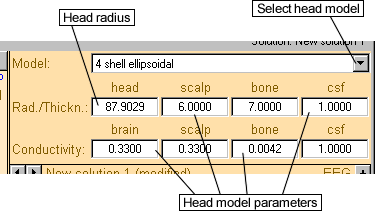
If no source is selected the parameter box looks like the figure below:
(Click on the region of interest to view a description.)
The top row shows the currently selected head model. The default model for EEG is the 4-shell ellipsoidal model. Different EEG models can be selected using the Head Model Selection list.
For EEG, you can select a standardized Realistic Head Model Approximation based on finite elements (FEM) with different conductivity ratios of brain to skull and anisotropies. For a detailed description of the different head models see chapter Head Models.
If the current channel type is MEG (as indicated by the EEG/MEG button in the channel box), the spherical MEG head model (Sarvas, 1987) and the individual FEM head model are available. Please note, that the individual FEM head model first has to be created in BESA MRI.
The head radius in millimeters which is used in the head models is given in the first text field labeled head. If the head radius is computed from the individual head it cannot be modified.
The head model parameters of the different head compartments are given in the text fields: The thicknesses of the scalp, of the bone, and of the cerebral spinal fluid (csf) are displayed in the second, third and fourth text fields of the upper row. The relative conductivities of brain, scalp, bone, and csf are displayed in the bottom row. Click onto the text fields to edit the current value.
If you click the right mouse button on a text filed while at least one head model parameter differs from its default value, the Head Model Text Field popup menu appears which allows to reset values to the default.
Note: The head model parameters are used in the 4 shell ellipsoidal and Polynomial 4 shells head models only.
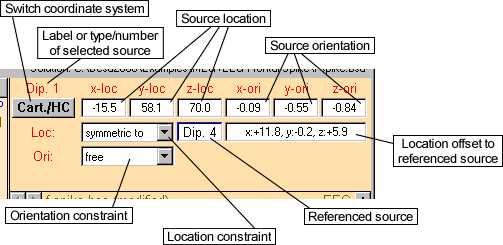
If a source is selected, the parameter box looks like this:
(Click on the region of interest to view a description.)
The coordinate system which is used to display or modify the source coordinates can be switched with the Coordinate System button at the top left. The following coordinate systems are available:
- (Cartesian) head coordinates: Defined by three reference points on the head known as fiducials. The unit is millimeter. The button is labeled Cart./HC.
- Talairach coordinates:
- (Cartesian) unit sphere coordinates (BESA coordinates): Defined by the best fit sphere. The button is labeled Cart./US.
- Polar unit sphere coordinates (polar BESA coordinates): Same coordinate system as above, but the coordinates are given in polar coordinates. The button is labeled Polar/US.
Note: A detailed description of the coordinate systems is given in the chapter Working with Electrodes and Surface Locations.
To the left of the Coordinate System button the location and orientation coordinates of the selected source are given in the text fields labeled as follows:* x-loc, y-loc, and z-loc: Location of the selected source in cartesian coordinates.
- x-ori, y-ori, and z-ori: Orientation of the selected source in cartesian coordinates (the length of the vector specified by the three orientation coordinates is 1)
- ecc, theta, and phi: Location of the selected source in polar coordinates (eccentricity, azimuth, and polar angle), visible only if polar coordinates are displayed.
- o-the and o-phi: Orientation of the selected source in polar coordinates (azimuth and polar angle). These text fields are visible only if polar coordinates are displayed.
The second and third row shows the current location and orientation constraints for the selected source. Four states are possible:* Free: No constraint is set. The source location/orientation can be fitted.
- Fixed: The source location/orientation is fixed during the next fit and will not be modified.
- Symmetric to (available for the source location only): The source location is set symmetric (mirrored into the other hemisphere) to the referenced source which is specified in the middle text field. The offsets to the symmetric location of the referenced source are given in the text field to the right.
- Bound to (available for the source location only): The source location is bound to the referenced source which is specified in the middle text field. The offsets to the location of the specified source are given in the text field to the right.
If you click onto the middle text field of the referenced source or the text field containing the location offset, the Set source constraint dialog box will open which allows to modify the referenced source and the location offset.
Using the Mouse
A left mouse click in the parameter box will toggle the display of the selected source parameters and the display of the head model parameters.
If you click the right mouse button somewhere in the parameter box, the Parameter Box popup menu appears with specific commands to this box.
Click on the source label to specify a new label.
Head Box
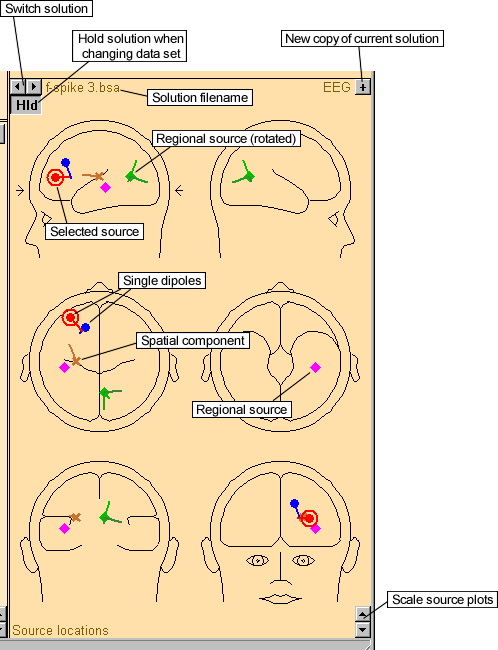
The Head Box shows six head schemes with the sources of the current solution. Each of the three standard views is displayed twice from opposite directions: First row sagittal view from left (left scheme) and from right (right scheme), second row transversal top view (left) and transversal view from bottom (right), and third row coronal view from behind (left) and frontal coronal view (right).
Note: If the 3D window is open the appearance of the head box is different. Only two head schemes are displayed. You will find more information at the end of this page.
(Click on the region of interest to view a description.)
A source is plotted in one view only if it is located in the forward hemisphere or slightly in the back hemisphere, so that, e.g. for the sagittal view (first row), a source is plotted only in the left head scheme if it is located in the left hemisphere, and not in the right top head scheme (in the figure below all sources except for the green one).
Note: You can specify the depth up to which sources are plotted in the back hemisphere (the so-called source transparency) in the Boxes Tab of the Preferences dialog box.
If the cursor is set, the size of the source plot depends on the strength of the source (the amplitude of the source waveform) at the cursor.
The description and filename of the current solution is given at the top of the head box. If the solution has not been stored yet the text New solution... is displayed. If any modifications of the solution have not yet been saved, this is indicated by appending the text "modified" to the filename. Set a new description by clicking on the text with the left mouse button.
The Switch Solution buttons at the top left corner, marked with small arrows, allow to switch between solutions. They are enabled only if there are at least two solutions. If you right click on these buttons while they are enabled the Switch Solution popup menu opens which allows for changing to a specified solution.
The Hold button below the Switch Solution buttons becomes important if more than one condition has been uploaded or the condition has more than one data set. It toggles between two settings:
- Up: When the user switches between data sets or conditions, it will also be switched to the solution which was last modified when the new data set was active.
- Down: When the user switches between conditions, the current solution will not be changed.
Clicking on the '+' button at the top right creates a new solution and copies the current solution to the new one. If the solution which was copied already has a file path (i.e. has been loaded or saved before), the file path of the new solution is modified such that it does not specify an existing file.
The button is disabled if no solution is available.
Note: The entry New Copy of Displayed Solution in the Solution menu provides the same functionality.
The Source Plot Scale buttons at the bottom right of the head box are used to adjust the size of the source plots. Note that two different settings are stored: One for the source display if the cursor has been set, one for the display without cursor. If you hold the Control-key in combination, the scale is reset to default.
Using the Mouse
A double-click on one of the head schemes creates a new source at that location. The type of the new source can be specified using the menu entry Options/Default Source Type. A double click on an existing source deletes it.
If a source is under the mouse the mouse changes to [[Image:|top]]. A single click with the left button turns the source under the mouse into the selected source. A double click deletes the source.
If the source under the mouse can be moved the mouse changes to [[Image:|top]]. You can move the source by dragging with the left mouse button (spatial components may not be moved). The source location is bound to the limits which have been set in the Limit of source location section in the Preferences dialog box.
If the orientation of a source can be modified the mouse changes to [[Image:|top]]( single dipoles only). Drag the vertex of the orientation to rotate the dipole. Use the Shift-key in combination if you want to rotate the orientation in the specified view only.
Note: If you want to drag the orientation even if it is hidden use the Control-key in combination.
If you double click on the filename of the solution, which is given at the top of the head box, a text box is displayed in which you may enter a description. If a solution description has been set, it is displayed instead of the filename. This description will be stored when the solution is saved.
If you click the right mouse button somewhere in the head box, the Head Box popup menu appears with commands specific to this box.
Head box display if the 3D window is open
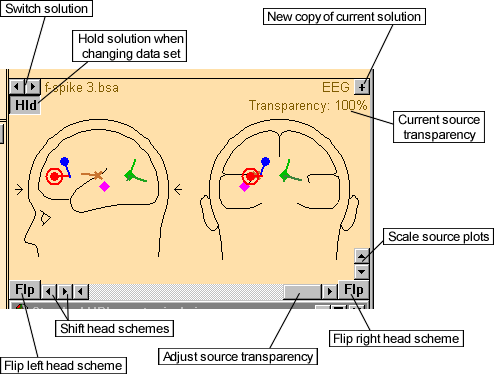
If the 3D window is open the appearance of the head box is different. Only two head schemes are displayed.
(Click on the region of interest to view a description.)
The Flip Head Scheme buttons (labeled Flp) at the bottom right and left of the window flip the associated head scheme. E.g. clicking onto the left Flp button in this image would switch the sagittal view from the left to the sagittal view from the right.
Use the Shift Head Scheme buttons (second and third button to the left, marked with small arrows) to scroll the head schemes until you see your desired view.
The Transparency scroll bar in the mid bottom changes the source transparency. A source is plotted in one view only if it is located in the forward hemisphere or as far in the back hemisphere as set by the transparency value - the depth up to which sources are plotted in the back hemisphere. Please see additional information in the section Source Transparency, (Preferences dialog box), use the Back button
of the Windows® help to jump back to this page.
3D Window
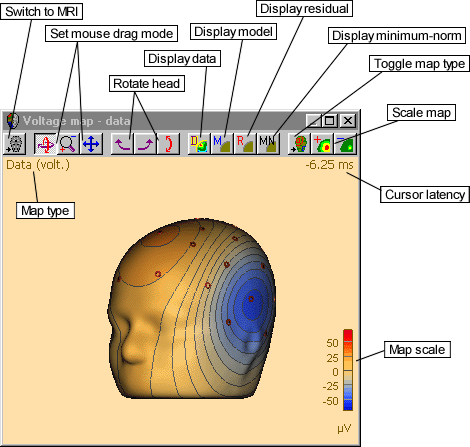
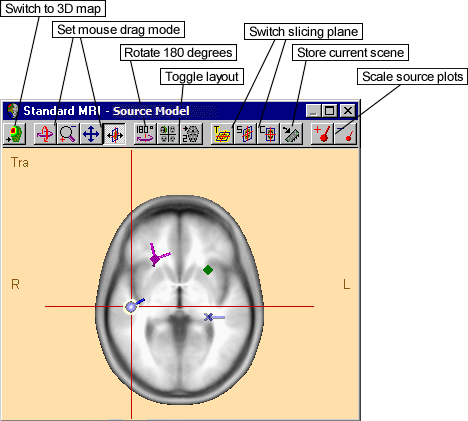
The 3D window is opened if a 3D map (fig. 1) or the anatomical view of an individual MRI or the BESA Research standard Brain (fig. 2) is displayed. It also opens if any of the 3D volume imaging or 3D surface imaging methods are used. (Use the popup menu entries Display MRI or Display 3D Maps.)
(Click on the region of interest to view a description.)
The sources of the current solution are displayed in the anatomical view (fig. 2), or in the cortical imaging view if this is activated via the popup menu using the right mouse button. The selected source is displayed with a golden halo around the source body.
The 3D window toolbar is explained in details in the 3D Window Toolbar section in the online help Reference chapter.
Using the Keyboard
A number of key combinations are useful for navigation/display in the 3D window if the 3D window is active (the title bar is blue). The most important commands with their default keys are listed here. Note that you can change the default keys in the Define hot keys dialog box, which also allows to specify additional key commands.
Command default key(s) and effects
- Decrement/Increment scale Num-, Num+: Decrements/Increments the map scale in the 3D map or the source plot size in the anatomical view.
- Move down/left/right/up Numpad-2, Numpad-4, Numpad-6, Numpad-8: If a source is selected, the source is moved within the current slice in steps of one millimeter in the corresponding direction. If no source is selected, the slicing center is moved instead. This only applies to the anatomical view.
- Slice backwards/forward Down, Up: If a source is selected the source is moved into the next slice, one millimeter out of or into the current anatomical view. If no source is selected the slicing center is sliced down or up instead. This only applies to the anatomical view.
- Switch to specific slice Shift-C, Shift-S, Shift-T: Switches to the coronal, sagittal, or transversal slice (anatomical view only).
- Display 3D maps M: Switches from the anatomical view to the 3D map. Works only if the cursor has been set.
- Display standard MRI A: Switches from the 3D map to the anatomical view.
Using the Mouse
Whenever an action with the left mouse button is possible the mouse cursor will change from the standard arrow to a special icon. The following mouse actions are possible:
New source
A double click on a surface (skin or brain) or inside an anatomical view will insert a new source at the associated 3D location. The type of the new source can be specified using the menu entry Options/Default Source Type.
Delete source
A double click on an existing source will delete the source after a confirmation box is closed with Yes.
Dragging with the left mouse button will rotate the current view. This action is available on a 3D map or on the 3D view of the anatomical view. The Rotation Mode button of the 3D window toolbar or the Shift-key have to be pressed.
Dragging with the left mouse button will zoom the current view. This action is available on a 3D map or on the 3D view of the anatomical view. The Zoom Mode button of the 3D window toolbar or the Shift- and Control-key have to be pressed.
Dragging with the left mouse button will rotate the current view. This action is available on a 3D map or on the 3D view of the anatomical view. The Move Mode button of the 3D window toolbar or the Control-key have to be pressed.
Dragging with the left mouse button will slice the current slicing center up and down. This action is available on the anatomical view only. The Slice Mode button of the 3D window toolbar or the Alternate-key have to be pressed in combination.
Dragging with the left mouse button will slice the current slicing center horizontally. This action is available on the 2D anatomical views only. The Slice Mode button of the 3D window toolbar or the Alternate-key must not be pressed.
![]() Set Slicing Center to Source Location
Set Slicing Center to Source Location
A single click with the left mouse button will select the source under the mouse (if not already selected) and set the current slicing center to the source location. A double click will delete the source.
This action is available on the anatomical view only if a source is under the mouse and this source must not be moved (e.g. a spatial component).
A single click with the left mouse button will select the source under the mouse (if not already selected). A double click will delete the source.
Dragging with the left mouse button will move the source horizontally to the displayed slice.
This action is available only if a source is under the mouse, this source may be moved (no spatial component), and the Move Mode button of the 3D window toolbar or the Control-key are pressed.
![]() Move Source and Slice Horizontally
Move Source and Slice Horizontally
A single click with the left mouse button will select the source under the mouse (if not already selected) and set the current slicing center to the source location. A double click will delete the source.
Dragging with the left mouse button will move the source horizontally to the displayed slice and set the current slicing center to the new source location.
This action is available only if a source is under the mouse, this source may be moved (no spatial component) and the Move Mode button, the Slice Mode button (of the 3D window toolbar), the Control- and Alternate-key are not pressed.
![]() Move Source and Slice Vertically
Move Source and Slice Vertically
A single click with the left mouse button will select the source under the mouse (if not already selected) and set the current slicing center to the source location. A double click will delete the source.
Dragging with the left mouse button will move the source vertically to the displayed slice and set the current slicing center to the new source location.
This action is available only if a source is under the mouse, this source may be moved (no spatial component) and the Slice Mode button of the 3D window toolbar or the Alternate-key are pressed.
If you click the right mouse button somewhere in the 3D window, the 3D Window popup menu appears with commands specific to this window.
