Difference between revisions of "BESA Research ERP Processing"
| (13 intermediate revisions by 4 users not shown) | |||
| Line 2: | Line 2: | ||
|title = Module information | |title = Module information | ||
|module = BESA Research Basic or higher | |module = BESA Research Basic or higher | ||
| − | |version = 6.1 or higher | + | |version = BESA Research 6.1 or higher |
}} | }} | ||
== <span style="color:#3366ff;"><span style="color:#00000a;">ERP Processing and Averaging</span></span> == | == <span style="color:#3366ff;"><span style="color:#00000a;">ERP Processing and Averaging</span></span> == | ||
| Line 29: | Line 29: | ||
Paradigms allow to use scripting techniques for averaging of multiple recordings. | Paradigms allow to use scripting techniques for averaging of multiple recordings. | ||
| − | They keep track of all relevant settings for averaging and make it easy to perform all necessary steps for optimal averaging of the data with a few mouse clicks. Each experimental task is described by a condition, in which trigger events are selected for averaging on the basis of user-defined boolean statements. Conditions can later be combined, e.g. to create grand averages or to form | + | They keep track of all relevant settings for averaging and make it easy to perform all necessary steps for optimal averaging of the data with a few mouse clicks. Each experimental task is described by a condition, in which trigger events are selected for averaging on the basis of user-defined boolean statements. Conditions can later be combined, e.g. to create grand averages or to form different conditions. |
The process of editing paradigm definitions is started using the menu entries <span style="color:#3366ff;">'''ERP / Open Paradigm'''</span> or <span style="color:#3366ff;">'''ERP / Edit Paradigm'''</span>, or the<span style="color:#3366ff;">''' ERP'''</span> push button in the main window, as shown in the figure below. | The process of editing paradigm definitions is started using the menu entries <span style="color:#3366ff;">'''ERP / Open Paradigm'''</span> or <span style="color:#3366ff;">'''ERP / Edit Paradigm'''</span>, or the<span style="color:#3366ff;">''' ERP'''</span> push button in the main window, as shown in the figure below. | ||
| − | [[Image:ERP Processing (1).gif ]][[Image:ERP Processing (2).gif | + | <div><ul> |
| − | + | <li style="display: inline-block;"> [[Image:ERP Processing (1).gif|thumb|300px|ERP menu. Select Open Paradigm to open a pre-defined paradigm file.]] </li> | |
| − | + | <li style="display: inline-block;"> [[Image:ERP Processing (2).gif|thumb|500px|BESA Research browses to the folder of pre-defined paradigms automatically. From the 'Directories' drop-down menu, the current data directory can be quickly accessed as well.]] </li> | |
| − | + | </ul></div> | |
| − | + | ||
| − | + | ||
| − | + | ||
| − | + | ||
| Line 49: | Line 45: | ||
* Trigger: define trigger codes by assigning names and other attributes. Attributes (e.g. "intensity") help to group triggers. | * Trigger: define trigger codes by assigning names and other attributes. Attributes (e.g. "intensity") help to group triggers. | ||
| − | * Condition: define a condition | + | * Condition: define a condition that selects trigger events from the experiment. Logical expressions can be combined to filter, for example, only the correct responses to a given task. |
* Epoch: define epochs for averaging, baseline, artifact rejection, stimulus artifacts, and possibly a delay in trigger administration | * Epoch: define epochs for averaging, baseline, artifact rejection, stimulus artifacts, and possibly a delay in trigger administration | ||
* Filter: edit filter settings for averaging | * Filter: edit filter settings for averaging | ||
| Line 57: | Line 53: | ||
| − | + | ==== Trigger ==== | |
| − | + | By default, triggers are defined by the trigger code. However, this definition is arbitrary and working with numbers instead of names is error-prone. The Trigger dialog tab in the Paradigm property sheet enables naming triggers and grouping triggers by making use of attributes. These attributes can be freely assigned, and each trigger obtains a unique definition for its attributes. | |
| − | + | Generally, the suggested order in which to proceed for trigger definition is: | |
| − | <span style="color:#3366ff;"> | + | # Define the attributes which cover all the different sub-groups of triggers |
| + | # For each attribute, define the different values the attribute can take | ||
| + | # Define the triggers by selecting the code and the appropriate attribute values, and using the <span style="color:#3366ff;">'''Set '''</span>button | ||
| − | |||
| − | |||
| − | |||
| + | The ''Trigger ''dialog tab contains two main sections: The upper part is used to define attributes and attribute values for the triggers, whereas the lower part shows the current definitions. | ||
| − | + | For example, to assign names to the trigger codes: | |
| − | <span style="color:#3366ff;"> | + | * Enter names in the edit boxes of the ''Attribute Values'' section (below the attribute “name”) |
| + | * Add them to the list using the <span style="color:#3366ff;">'''Add to List'''</span> button. | ||
| + | * Define them by selecting code and name in the list box under the attribute “name” and clicking the <span style="color:#3366ff;">'''Set'''</span> button. | ||
| − | |||
| − | |||
| − | |||
| − | |||
| − | |||
| − | |||
| − | |||
| − | |||
[[Image:ERP Processing (3).gif ]] | [[Image:ERP Processing (3).gif ]] | ||
| + | ''Trigger tab. The trigger codes are shown. The attribute “name” is defined automatically.'' | ||
| − | |||
| − | + | ==== Condition ==== | |
| − | + | A condition holds all information connected with a task or a specific event type. | |
| − | + | In the ERP module, averaging is performed on the basis of conditions. A condition is given by a logical expression that defines which trigger events are accepted for averaging. The "condition" tab makes it possible to define complex logic expressions and to see immediately how many matching trigger events result. | |
| − | + | The example conditions shown in the figure below are defined in Tutorial 1: ''‘Using a P300 Paradigm for'' ''Averaging ''' in help chapter ''“ERP / Functions… / Paradigms for Averaging”,'' which gives a comprehensive overview of the features of the averaging module. | |
| − | |||
| − | |||
[[Image:ERP Processing (2).png ]] | [[Image:ERP Processing (2).png ]] | ||
| + | ''Editing a paradigm: Conditions can be defined by combining trigger definitions using boolean logic. This example shows definitions of three conditions (Rare, Standard, Hit) with a different number of matching events (40, 160, 134).'' | ||
| − | |||
| + | ==== Epoch ==== | ||
| − | + | The dialog tab'' Epoch'' is used to set the epochs which define the averaging interval. For each condition, an individual set of epochs can be defined for averaging by the edit boxes at the top of the dialog tab. At the bottom of the tab, the current settings for all conditions can be viewed. | |
| − | + | The push buttons in the center of the tab control the editing process. Two push buttons at the bottom right are for loading and saving a paradigm file. | |
| − | |||
| − | |||
| − | |||
| − | |||
| − | |||
| − | |||
| − | |||
| − | |||
| − | |||
| − | |||
| − | |||
| − | |||
| − | |||
| − | |||
[[Image:ERP Processing (3).png]] | [[Image:ERP Processing (3).png]] | ||
| − | + | ''Epoch tab. 4 different epochs can be defined for each condition. A stimulus delay time can also be specified.'' | |
| − | + | ||
| − | + | ||
| − | + | ||
| − | + | ||
| − | + | ||
| − | + | ||
| − | + | ||
| − | + | ||
| − | + | ||
| − | + | ||
| − | + | ||
| − | + | ||
| − | + | ||
| − | + | ||
| − | + | ||
| − | + | ||
| − | + | ||
| − | + | ||
| − | + | ||
| − | + | ||
| − | + | ||
| − | + | ||
| − | + | ||
| − | + | ||
| − | + | ||
| − | + | ||
| − | + | ||
| − | + | ||
| − | + | ||
| − | + | ||
| − | + | ||
| − | + | ||
| − | + | ||
| − | + | ||
| − | + | ||
| − | + | ||
| − | + | ||
| − | + | ||
| − | |||
| − | + | ==== Filter ==== | |
| − | + | The ''Filter ''dialog tab allows you to change filter settings prior to averaging the data. The low and high pass filters can be chosen differently for the artifact scan and the average. '''Note''': If the paradigm is edited for the first time, default filter settings are used. These can differ from the filter settings which you set in the review window. If a paradigm file was opened which does not contain filter settings, the filter settings which were chosen in the base module are displayed in the dialog tab. | |
| − | |||
[[Image:ERP Processing (4).png]] | [[Image:ERP Processing (4).png]] | ||
| + | ''Filter tab. Low cutoff, high cutoff, and band pass filters can be applied.'' | ||
| − | |||
| + | ==== Artifact ==== | ||
| − | + | The ''Artifact'' dialog tab provides an easy way to define artifact rejection thresholds and to exclude bad channels and bad sweeps from the analysis. This is achieved by scanning the data file and then using the graphics display presented in the center of the dialog tab, which shows channels and sweeps sorted according to user-defined criteria. | |
| − | + | If the user does not check any of the options ''Fixed Thresholds'' and ''Artifact Scan Tool'', only regions that were explicitly marked as artifacts by the user will be excluded from the averages. If the option ''Fixed Thresholds'' is checked, the thresholds given in the edit boxes for amplitude and gradient are used to reject sweeps contaminated by artifacts. | |
| − | + | The option ''Artifact Scan Tool'' provides an interactive tool for the comprehensive detection and rejection of both artifact-loaded channels and sweeps. | |
| − | + | The figure below shows the result of an artifact scan. The trials are depicted in the columns of the display, sorted according to the highest amplitudes. Trials are rejected by mouse drag of the vertical cursor or by adjusting the rejection threshold for maximum amplitude, gradient, or minimum variance within a trial. The channels are depicted in the rows of the display, sorted according to the mean amplitude values over the trials. Similarly to excluding trials, a mouse drag of the horizontal cursor at the top of the display excludes channels. | |
| − | |||
| − | |||
| − | |||
| − | |||
| − | |||
| − | |||
| − | |||
| − | |||
| − | |||
| − | |||
| − | |||
| − | |||
| − | |||
| − | |||
| − | |||
| − | |||
| − | |||
| − | |||
[[Image:ERP Processing (5).gif ]] | [[Image:ERP Processing (5).gif ]] | ||
| + | ''Artifact scan result. The channel at the top shows significantly higher amplitudes than the rest, indicated by the lighter color. Trials in the rightmost columns have been excluded from averaging.'' | ||
| − | |||
| + | ==== Average ==== | ||
| − | + | The ''Average'' dialog tab is used to define | |
| − | + | * which conditions are averaged | |
| + | * which range of the data file is searched for trigger events matching the conditions | ||
| + | * whether automatic or query search is performed | ||
| − | |||
| − | |||
| − | |||
| + | The left part of the ''Average'' tab contains radio buttons to select the search range within the data file. | ||
| − | + | The central part contains a list of available conditions and of available constraints for averaging. | |
| − | + | The list box array at the bottom shows the active and inactive conditions, the total number of matches, and the selected constraints. It provides an overview about the conditions which are selected. To add a condition to the list, select the condition and the constraint in the list boxes at the top, and click the <span style="color:#3366ff;">'''Add to List'''</span> button. | |
| − | + | The right part contains additional sections for defining statistics and toggling between query averaging and automatic averaging. | |
| − | + | Two push buttons at the bottom right are for loading and saving a paradigm file. | |
| − | |||
| − | |||
| − | |||
| − | |||
| − | |||
| − | |||
| − | |||
| − | |||
| − | |||
| − | |||
| − | |||
[[Image:ERP Processing (6).gif ]] | [[Image:ERP Processing (6).gif ]] | ||
| + | ''Averaging tab. Range, conditions, and constraints for split-half averaging can be adjusted.'' | ||
| − | |||
| + | The tutorial in help chapter ''"ERP / Functions... / Paradigms... / Tutorial 1: Using a P300 Paradigm for'' ''Averaging"'' gives an introduction to the available features. Different conditions can be combined to analyze experimental paradigms of high complexity. | ||
| − | + | A detailed description of the features can be found in the electronic help chapter ''"ERP / Reference / Using Paradigms to Average".'' | |
| − | |||
| − | |||
| − | + | ==== Tutorial 1: Using a P300 Paradigm for Averaging ==== | |
| + | This example illustrates how to define and evaluate experimental paradigms using the ERP module. We will work on an experiment with an auditory oddball paradigm. The paradigm involves frequent and rare tones of different pitch and a motor response. The following list shows the encoding of the three different events to triggers: | ||
| Line 261: | Line 169: | ||
|- style="background-color:#ffffff;border:0.5pt solid #00000a;padding-top:0cm;padding-bottom:0cm;padding-left:0.199cm;padding-right:0.191cm;" | |- style="background-color:#ffffff;border:0.5pt solid #00000a;padding-top:0cm;padding-bottom:0cm;padding-left:0.199cm;padding-right:0.191cm;" | ||
|| <span style="color:#3366ff;"><span style="color:#00000a;">'''File name'''</span></span> | || <span style="color:#3366ff;"><span style="color:#00000a;">'''File name'''</span></span> | ||
| − | |||
| − | |||
| − | |||
|| <span style="color:#3366ff;"><span style="color:#00000a;">'''Triggers'''</span></span> | || <span style="color:#3366ff;"><span style="color:#00000a;">'''Triggers'''</span></span> | ||
| style="color:#00000a;" | | | style="color:#00000a;" | | ||
| Line 269: | Line 174: | ||
|- style="background-color:#ffffff;border:0.5pt solid #00000a;padding-top:0cm;padding-bottom:0cm;padding-left:0.199cm;padding-right:0.191cm;" | |- style="background-color:#ffffff;border:0.5pt solid #00000a;padding-top:0cm;padding-bottom:0cm;padding-left:0.199cm;padding-right:0.191cm;" | ||
|| <span style="color:#3366ff;"><span style="color:#00000a;">Freq-1200Hz-Resp-L.cnt</span></span> | || <span style="color:#3366ff;"><span style="color:#00000a;">Freq-1200Hz-Resp-L.cnt</span></span> | ||
| − | || | + | || Frequent tone (1200Hz) |
| − | + | Rare tone (800Hz) | |
| − | + | Motor response (left hand) | |
| − | || | + | || Trg. 1 |
| − | + | Trg. 2 | |
| − | + | Trg. 128 | |
| − | || | + | || frequent tone |
|- | |- | ||
|} | |} | ||
| − | |||
| − | |||
| − | + | The electrode positions were digitized. The file with the extension Freq-1200Hz-Resp-L.sfp contains the digitized 3D coordinates for the EEG. | |
| + | Follow the steps in the next section to see how the ERP module allows to customize the paradigm and to evaluate and average conditions. | ||
| − | |||
| − | + | '''A. Open a pre-defined paradigm''' | |
| + | '''1. Load data''' | ||
| − | <span style="color:#3366ff;"><span style="color:#00000a;">''' | + | * Load data file "<span style="color:#ff9c00;">'''Freq-1200Hz-Resp-L.cnt'''</span><span style="color:#3366ff;"><span style="color:#00000a;">" in the folder "</span></span><span style="color:#3366ff;"><span style="color:#00000a;">''Examples\ERP-P300-Auditory''</span></span><span style="color:#3366ff;"><span style="color:#00000a;">".</span></span> |
| + | * Select ''File/Head Surface Points'' and ''Sensors/Load Coordinate Files...'' Browse for the coordinate files <span style="color:#ff9c00;">'''P300-Aud.ela'''</span> and <span style="color:#ff9c00;">'''P300-Aud.sfp '''</span> in the first two rows. They contain the type and location of the recorded electrodes. Enter '8mm' as electrode thickness, because in this example the coordinates specified in the sfp-file were measured 8mm away from the head surface. | ||
| − | |||
| − | |||
| − | |||
| − | |||
| − | |||
[[Image:ERP Processing (7).gif ]] | [[Image:ERP Processing (7).gif ]] | ||
| − | + | '''2. Open a pre-defined paradigm definition''' | |
| + | * Choose the menu entry <span style="color:#3366ff;">'''ERP/Open Paradigm'''</span>. A file selection box appears. | ||
| − | + | [[Image:ERP Processing (2).gif ]] | |
| + | * Choose the folder <span style="color:#3366ff;">''"Auditory"''</span> and open the paradigm file "<span style="color:#ff9c00;">'''P300.PDG'''</span>". Note that the combo box at the bottom of the file selection box enables a fast change between the default paradigm directory, and the directory where the data is stored. | ||
| − | |||
| − | |||
| + | The dialog box that appears consists of several pages ("tabs"). The tab which you see is divided into three sections. The list box on the left shows the current number of matches for all defined conditions. In this case, 3 conditions are defined: | ||
| − | + | * Rare | |
| − | * | + | * Standard |
| − | * | + | * Hit |
| − | * | + | |
[[Image:ERP Processing (2).png ]] | [[Image:ERP Processing (2).png ]] | ||
| + | Upon reading the paradigm, the conditions were automatically evaluated. For all three conditions, matches were found. | ||
| − | |||
| − | |||
| − | |||
| − | |||
| + | * In the list box in the center of the page, the currently defined conditions are displayed. The right part contains the command buttons. We will learn more about them later. | ||
| + | * Leave the page by selecting the tab "Epoch" at the top. | ||
| − | |||
| − | + | '''B. Average conditions''' | |
| − | + | '''1. Edit Averaging Epochs''' | |
| Line 341: | Line 239: | ||
| − | + | All three lines are highlighted since they all hold the same epoch settings which were entered into the edit boxes in the top half of the tab. | |
| − | + | The epoch which is used for calculating the baseline is set to -100 ms (start position) and 0 ms (end position) by default. | |
| − | * | + | * Select the last condition "Hit" in the list by a single click with the left mouse button. The settings are automatically copied to the edit boxes. In the edit section, change the averaging epoch to -800 ms (start position) and +100 ms (end position). Click the button <span style="color:#3366ff;">'''"Assign to Selected"'''</span> which changes the epoch settings for this condition only. This allows you to average the pre-stimulus potentials for the motor response selectively. You will notice that the artifact rejection interval was also updated, to fit into the newly defined averaging interval. Before you move on to the tab "Filter", adjust the Baseline Definition Epoch to [-800 ms, -700 ms] and click the button "<span style="color:#3366ff;">'''Assign to Selected".'''</span> |
| − | |||
| − | + | '''2. Filter Settings''' | |
| − | + | In the "Filter" tab, the low-frequency cutoff filter and the high-frequency cutoff filter can be edited. | |
| − | * | + | * If the high cutoff filter is enabled for either artifact scan or averaging, disable it by clicking off the checkboxes. Switch to the "Artifact" tab. |
| − | + | '''3. Artifact Rejection''' | |
| − | + | The artifact rejection tool offers two methods of artifact rejection. If the check box "''Fixed Thresholds''" is checked, the thresholds given at the right of the tab are used as limits that must not be exceeded in a trial. If the check box "''Artifact Scan Tool''" is checked, a scan of the data set is used to find artifacts. | |
| − | + | * Press the green "<span style="color:#3366ff;">'''Start Scan'''</span>" button. The data file is scanned for artifacts. After the scan is completed, a color-coded representation of maximum signal in channels and trials appears. This scan only has to be performed once for a data file, unless conditions are changed. The next time the paradigm is opened with the "<span style="color:#3366ff;"><span style="color:#00000a;">''Edit Paradigm"''</span> command (cf. part C of this tutorial), the scan result will be available. | |
| − | |||
| − | |||
| − | |||
| − | |||
[[Image:ERP Processing (5).png]] | [[Image:ERP Processing (5).png]] | ||
| − | * | + | * The trials of the three active conditions are sorted according to their maximum amplitude from left to right. The red bar at the bottom indicates which of the trials are currently marked as artifacts due to their high amplitude. The channels are sorted according to the mean of the maximum amplitudes of the trials from bottom to top. Move the mouse pointer to the top of the display. The cursor changes to an up-down arrow. Click and drag the cursor down with the left mouse button to exclude the topmost channel, which carries an EKG artifact. |
| − | * | + | * Click on the button "<span style="color:#3366ff;">'''Gradient'''</span>" at the bottom of the dialog tab. The display changes to show the maximum gradients in the trials. The gradient is defined as the amplitude difference between two neighboring samples. Move the mouse pointer to the right edge of the display. When the cursor changes to a left-right arrow, click and drag the cursor to the left with the left mouse button to exclude the sweeps with the highest gradients, which are due to eye artifacts. |
| − | * | + | * At the new position of the dividing line which separates artifacts from good trials, press the right mouse button. A popup menu with information about the channel and trial at the cursor position appears. |
| + | [[Image:ERP Processing (9).gif ]] | ||
| − | |||
| + | * Choose the menu entry "<span style="color:#3366ff;">'''Show Trial".'''</span> The trial is displayed in the EEG. If it still carries an artifact, more sweeps should be excluded. | ||
| + | * For more information about the artifact scan tool, please refer to the corresponding reference section in the electronic help. Switch to the "Average" tab now. | ||
| − | |||
| − | |||
| + | '''4. Averaging''' | ||
| − | + | * At the bottom of the Average dialog tab, a list of currently selected conditions for averaging is shown. It already contains the three conditions for which matches were found in the EEG file. The right-most column indicates that all trigger events which matched the conditions will be averaged ("A"). | |
| − | + | * Double-click on the condition "Hit" in the list box at the bottom. The cross in front of the condition name disappears, which indicates that this condition will not be averaged. Double-click it again to activate averaging of the condition again. | |
| − | + | * Click the green button <span style="color:#3366ff;">'''"Average"'''</span> on the right to start averaging. The progress is shown in an information window. | |
| − | + | ||
| − | + | ||
| − | + | ||
| − | + | ||
| − | + | ||
| − | + | ||
| − | * | + | |
| − | * | + | |
| − | * | + | |
| − | + | ||
| − | + | ||
| − | + | ||
| − | + | ||
| − | + | ||
| − | + | ||
| − | + | [[Image:ERP1.png]] | |
| − | <span style="color:#3366ff;"><span style="color:# | + | To cancel the averaging process, press any key. A message box appears. If you choose "<span style="color:#3366ff;">'''No'''</span>" averaging is continued. Choosing "<span style="color:#3366ff;">'''Yes'''</span>" stops the averaging process and asks you for a file name for each condition. After saving, the new averaged file is opened and the averaged segments are automatically displayed in the Top Viewer window. If you choose "<span style="color:#3366ff;">'''Cancel'''</span>", the results for the condition are not saved. |
| − | + | '''C. Edit a pre-defined paradigm''' | |
| − | |||
| + | '''1. Load data and paradigm file''' | ||
| − | < | + | * With file "<span style="color:#ff9c00;">'''Freq-1200Hz-Resp-L.cnt'''</span>" open, choose menu entry <span style="color:#3366ff;">'''ERP/Edit Paradigm'''</span>, which opens the paradigm again (the copy of the paradigm file that was stored in the data directory), including the changes which were made in the last session. |
| − | |||
| − | + | '''2. Edit trigger definition''' | |
| + | * Choose the tab "Trigger" on the top left. You now see the definition of triggers in the list view box at the bottom. | ||
| − | |||
[[Image:ERP Processing (8).png]] | [[Image:ERP Processing (8).png]] | ||
| − | * | + | * The top half of the tab contains the edit section. In the top row, attributes which describe experimental categories can be defined or deleted. The next row shows the attribute values which are available. The values which are currently active for the selected trigger code (left) are highlighted. |
| − | * <span style="color:#3366ff;"><span style="color:# | + | * Trigger code 128 does not have a proper definition for the attribute "frequency". To change the definition: |
| + | ** In the list box below the attribute "code" (left), choose code 128. | ||
| + | ** In the edit box below the attribute "frequency", type in "undefined". Click the push button "<span style="color:#3366ff;">'''Add to List'''</span>" on the righthand side, which adds the new value into the list box and selects it automatically. | ||
| + | ** Click the button "<span style="color:#3366ff;">'''Set'''</span>" to set the new definition for trigger code 128. | ||
| + | ** Alternatively: right-click with the mouse directly on the value which you want to change in the list view box at the bottom of the tab. See what happens... (more information about defining triggers can be found in the electronic help reference section). | ||
| + | ** The definition for trigger 128 has changed. Choose the tab "Condition" (top of the page) to get back to the condition page. | ||
| − | |||
| − | |||
| − | |||
| − | |||
| − | |||
| + | '''3. Edit conditions''' | ||
| − | + | * Switch to the 'Condition' tab. Select the last line of the condition edit list box (center of page) by a single click with the left mouse button. The name of the condition appears in the top left corner of this section of the page. | |
| − | |||
| − | + | You can edit the name in the name edit field, and rename the condition by clicking the "<span style="color:#3366ff;">'''Replace"'''</span>" button. | |
| + | Now we will add a new condition that links the standard stimulus with a response time: | ||
| + | A new condition is defined as follows: In the name field, type in a new name, e.g. "Resp_Time". | ||
| − | + | In the list box "Qualifier", select "CURRENT". | |
| − | + | In the list box "Attribute", select "type". | |
| − | + | In the list box "Operator", select "IS". | |
| − | + | ||
| − | + | In the list box "Value", select "auditory". | |
| − | + | Click the <span style="color:#3366ff;">'''"Insert"'''</span> button to start up the new condition. The name is automatically assigned to the new condition. | |
| − | + | In the list box "Qualifier", select "NEXT". | |
| − | + | In the list box "Attribute", select "Interval". | |
| − | + | In the list box "Operator", select "IS LESS THAN". | |
| − | + | In the edit box that appeared under "Value", type 500. | |
| − | + | Click the "<span style="color:#3366ff;">'''AND"'''</span> button to extend the condition. | |
| − | + | In the list box "Qualifier", select "NEXT". | |
| − | + | In the list box "Attribute", select "name". | |
| − | + | In the list box "Operator", select "IS". | |
| − | + | In the list box "Value", select "response". | |
| − | + | Finish off the condition by clicking the <span style="color:#3366ff;">'''"AND"'''</span> button again. | |
| − | |||
| − | + | * The new condition is automatically evaluated. 160 matches are found, i.e. in all cases, the response was within 500 ms. | |
| + | * Select the line "Next.Interval IS LESS THAN 500 ms" in the condition. Enter the value "300" in the edit box at the top right of the tab and click the "<span style="color:#3366ff;">'''Replace'''</span>" button. The condition changes accordingly and is re-evaluated. Only 142 matches are found now. | ||
| − | |||
| − | |||
| − | |||
| − | |||
| − | |||
| − | |||
| − | |||
| − | |||
| − | |||
| − | |||
| − | |||
| − | |||
| − | |||
[[Image:ERP Processing (9).png]] | [[Image:ERP Processing (9).png]] | ||
| − | * | + | * If you leave the dialog box with the "<span style="color:#3366ff;">'''OK'''</span>" button, the settings are automatically stored in the data directory if the directory is writeable. If you choose the menu entry <span style="color:#3366ff;">'''ERP/Edit Paradigm'''</span> in the future, this specific definition will be opened. |
| − | * | + | * Choose ''ERP/Average'' again. You will see that four conditions are selected for averaging. The newly defined condition is active. If you just want to compare the condition "Resp_Time" with the one that did not have a time limit ("Standard"), select the other two entries (by holding down the "<span style="color:#3366ff;">'''CTRL'''</span>" button on the keyboard while selecting) and click the button "<span style="color:#3366ff;">'''Remove from List'''</span>" to remove these conditions from the averaging list. Only two conditions are now active for averaging. |
| + | === Top View of Data Segments === | ||
| − | + | Any EEG or MEG data segment can be viewed and analyzed in the Top View window. Waveforms are arranged according to their position on the head. The various options include peak finding, analysis and annotation, 3D mapping of amplitude or current source density, overplot of several conditions, and many more. | |
| − | + | A detailed description of the features is given in online help chapter “''ERP / Reference / Viewing and Analyzing Data in the Top View”.'' | |
| − | |||
| − | |||
| − | |||
| − | |||
| − | |||
| − | |||
| − | |||
| − | |||
| − | |||
| − | |||
| − | |||
| − | |||
| − | |||
| − | |||
| − | |||
| − | |||
[[Image:ERP Processing (10).png]] | [[Image:ERP Processing (10).png]] | ||
| + | ''Topographic view of averaged data in a 32-channel auditory evoked ERP experiment. Two conditions are overplotted. A map of the N100 in one condition is shown. Channel amplitudes at the N100 latency are displayed'' | ||
| − | |||
| + | To view a segment or a set of segments in the Top View window, right-click on the segment waveforms and select '''''Top View''''' from the popup menu that appears. The Top Viewer window comes up, displaying the first segment in the data file. To switch to another segment, click on the segment name in the top line; select several segments for overplot by holding down the <span style="color:#3366ff;">'''<CTRL>'''</span> key while clicking on the segment names. Note that even if several conditions are shown, only one condition is active for analysis. The active condition is indicated by bold print in the top line, and in the title bar of the window. | ||
| − | |||
| + | '''Measuring peaks and amplitudes''' | ||
| − | <span style="color:#3366ff | + | <span style="color:#3366ff;">'''Note: There are powerful tools for peak and amplitude analysis and export in the Combine Conditions, Channels, Find Peaks Module.'''</span> |
| − | + | '''''Peaks''''' | |
| − | + | To measure peaks and peak areas in the Top Viewer, right-click into a waveform between the baseline and the peak, and select the option '''''Find and Mark Peak''''' from the popup menu. If the peak is small, operate on the zoomed waveform: Right-click onto the waveform, select '''''Zoom Waveform''''' from the popup menu and then proceed to mark the peak. The ''Peak Finding'' dialog box appears and shows the result of the peak search: | |
| − | + | ||
| − | + | ||
| − | + | ||
| − | + | ||
| − | + | ||
| − | + | ||
| − | + | ||
| − | + | ||
| − | + | ||
| − | + | ||
| − | + | ||
| − | + | ||
| − | + | ||
[[Image:ERP Processing (14).gif ]] | [[Image:ERP Processing (14).gif ]] | ||
| + | ''Result of a peak search in the waveform of electrode T3 of a single epileptic spike. The peak amplitude is -50.7 µV. The peak latency is 5 milliseconds after the mid-latency of the search pattern.'' | ||
| − | |||
| − | |||
| − | |||
| − | |||
| − | |||
| − | |||
| − | |||
| − | |||
| − | |||
| − | |||
| − | |||
| − | |||
| − | |||
| − | |||
| − | |||
| − | |||
| − | |||
| − | |||
| − | |||
| − | |||
| − | |||
| − | |||
| − | |||
| − | |||
| − | |||
| − | |||
| − | |||
| − | |||
| − | |||
| − | |||
| − | |||
| − | |||
| − | < | + | A peak search can also be initiated from the menu entry <span style="color:#3366ff;">'''Analysis / Find Peaks'''</span>. The search channel and time range can then be specified in the top row of the dialog box. Click the <span style="color:#3366ff;">'''Find '''</span>button to start the search. |
| − | + | Please refer to the online help'' Reference ''chapter for a detailed description of the peak finding tool. | |
| − | |||
| − | + | '''''Waveform amplitudes''''' | |
| − | < | + | To display amplitudes at specific latencies, double-click on a waveform and drag the cursor to the desired latency or use the <span style="color:#3366ff;">'''left-right arrow keys'''</span> on the keyboard. The latency is displayed at the bottom of the window, and a 3D map appears in the top right corner. From the <span style="color:#3366ff;">'''View '''</span>menu, select the '''''Preferences''''' option. In the dialog box which appears, select the tick marks '''''Show Labels''''' and '''''Show Amplitudes''''': |
| − | |||
[[Image:ERP Processing (15).gif ]] | [[Image:ERP Processing (15).gif ]] | ||
| − | + | '''Please note:''' Peak latencies and amplitudes can be determined over multiple files in a quick automatized way using scripts. Please refer to Chapter "''Batch Processing'' ''and Combining Conditions / Combine Conditions".'' | |
| − | + | '''Montages''' | |
| − | + | The displayed montage in the Top Viewer can be any arbitrary montage. Peak amplitudes are automatically adapted to the currently applied montage. When the Top Viewer window opens, the montage selected in the BESA Research main window is selected by default. Use the <span style="color:#3366ff;">'''Montage '''</span>menu or click on the text at the bottom left to switch to another montage. | |
| − | + | '''Advanced viewing options''' | |
| − | + | Further options include: | |
| − | * | + | * Moving waveforms in the display, zooming individual channels, hiding channels, zooming the whole display. |
| − | * | + | * Selecting only a part of the epoch for display. |
| − | * | + | * 3D whole head mapping of voltage or current source density. |
| − | * | + | * Changing display options such as tick marks, channel labels, baseline information, font sizes, colors, and more. |
| − | * | + | * Display of standard deviations, and event-related (de-)synchronization (this requires bandpass filtering of the data during averaging, see the corresponding help chapter). |
| − | + | Please refer to the online help chapter “''ERP / Reference / Viewing and Analyzing Data in the Top View'' for more information. | |
| − | + | === Grand Averaging and Combining Conditions === | |
| − | + | ||
| − | + | ||
| − | + | ||
| − | + | ||
| − | + | ||
| − | + | ||
| − | + | ||
| − | + | ||
| − | + | ||
| − | + | ||
| − | + | ||
| − | + | ||
| − | + | ||
| − | + | ||
| − | + | ||
| − | + | ||
| − | + | ||
| Line 644: | Line 433: | ||
| − | The ERP Module allows for quick combination of averaged segments, e.g. to create Grand Averages over subjects or to compute weighted sums and differences of conditions. | + | The ERP Module allows for a quick combination of averaged segments, e.g. to create Grand Averages over subjects or to compute weighted sums and differences of conditions. |
| − | Conditions from different recordings/subjects can be combined in a convenient way using scripts. The menu entry "<span style="color:#3366ff;">'''ERP/Combine Conditions, Channels, Find Peaks'''</span>" allows for grand averaging and creating sums and differences between conditions. It also provides a tool for spatial and temporal resampling, and allows to perform an automatic peak analysis of multiple averaged files. For a detailed description of the 'Combine Conditions, Channels, Find Peaks' functions, please refer to the help chapter "''Batch Processing and Combining Conditions / Combine Conditions''". | + | Conditions from different recordings/subjects can be combined in a convenient way using scripts. The menu entry "<span style="color:#3366ff;">'''ERP/Combine Conditions, Channels, Find Peaks'''</span>" allows for grand averaging and creating sums and differences between conditions. It also provides a tool for spatial and temporal resampling, and allows to perform an automatic peak analysis of multiple averaged files. For a detailed description of the 'Combine Conditions, Channels, Find Peaks' functions, please refer to the help chapter "'''[[BESA_Research_Batch_Processing#Combine_Conditions.2C_Channels|Batch Processing and Combining Conditions / Combine Conditions]]'''". |
[[Image:ERP Processing (17).gif ]] | [[Image:ERP Processing (17).gif ]] | ||
| − | |||
=== Managing Triggers === | === Managing Triggers === | ||
| Line 656: | Line 444: | ||
==== Creating Triggers from EMG/EEG Channels ==== | ==== Creating Triggers from EMG/EEG Channels ==== | ||
| − | It is possible to create new trigger events from any of the recorded channels. This is achieved by defining parameters that characterize the features of the event. After the parameters are defined, the whole EEG /MEG is searched for events which match the parameters, and new trigger events are created. The steps to be taken are illustrated in the help tutorial chapter '' | + | It is possible to create new trigger events from any of the recorded channels. This is achieved by defining parameters that characterize the features of the event. After the parameters are defined, the whole EEG /MEG is searched for events which match the parameters, and new trigger events are created. The steps to be taken are illustrated in the help tutorial chapter [[BESA_Research_ERP_Processing#Tutorial_2:_Creating_Triggers_from_EMG|"''ERP / Functions... / Managing Triggers / Tutorial 2: Creating Triggers from EMG''"]]. |
Briefly, the procedure to create triggers for a recurring pattern is as follows: | Briefly, the procedure to create triggers for a recurring pattern is as follows: | ||
| − | 1. Mark a typical occurrence of the pattern by | + | 1. Mark a typical occurrence of the pattern by left mouse drag. |
2. Use menu item <span style="color:#3366ff;">'''ERP / Create Triggers from EMG/EEG'''</span> to open the ''Schmitt Trigger'' dialog box. | 2. Use menu item <span style="color:#3366ff;">'''ERP / Create Triggers from EMG/EEG'''</span> to open the ''Schmitt Trigger'' dialog box. | ||
| Line 668: | Line 456: | ||
4. Set the Schmitt Trigger parameters. The Schmitt Trigger is characterized by 4 parameters: | 4. Set the Schmitt Trigger parameters. The Schmitt Trigger is characterized by 4 parameters: | ||
| − | * | + | * '''Threshold''' (upper threshold): the threshold that the signal has to exceed |
| − | * | + | * '''Limit During Dead Time''' (lower threshold): the threshold that the signal must not exceed during the dead time before the trigger |
| − | * | + | * '''Dead Time (Prior to Trig)''': the time interval before the trigger where the signal must be lower than the lower thresholds |
| − | * | + | * '''Return Time (Below Limit)''': the time during which the signal has to return below the threshold |
| Line 692: | Line 480: | ||
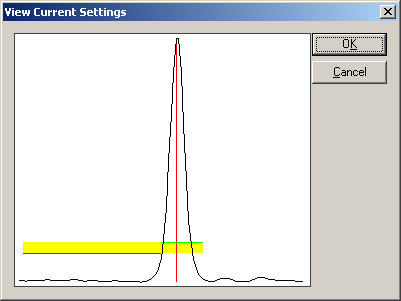
| − | + | ''The waveform of a trigger channel can be rectified and filtered to define trigger events. In the example above, the EMG channel FDIL is scanned for myoclonic discharges. The small window shows the waveform of the marked epoch after appropriate filtering.'' | |
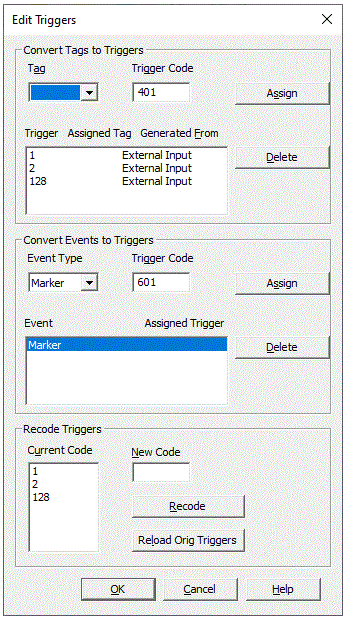
| + | ==== Editing Triggers ==== | ||
| − | ==== <span style="color:#3366ff;"><span style="color:#00000a;"> | + | Patterns, tags, and markers can be converted into trigger events using the <span style="color:#3366ff;"><span style="color:#00000a;">'''''Edit Triggers'''''</span></span><span style="color:#3366ff;"><span style="color:#00000a;"> tool. After conversion, tags found in a pattern search can be used in conditions: they can be analyzed by the paradigm tool which controls and stores the complete pre-averaging process. This facilitates for example the averaging of epileptic spikes which were hand-marked or found by a pattern search (cf. chapter </span></span><span style="color:#3366ff;"><span style="color:#00000a;">''"Review / Searching and Averaging"''</span></span><span style="color:#3366ff;"><span style="color:#00000a;">).</span></span> |
| − | + | The <span style="color:#3366ff;"><span style="color:#00000a;">'''''Edit Triggers'''''</span></span><span style="color:#3366ff;"><span style="color:#00000a;"> tool is also useful to delete triggers which were created earlier, to change trigger codes, or to create triggers for FFT averaging with graphical artifact rejection on the basis of the paradigm tool.</span></span> | |
| − | + | A detailed description of the features is given in the online help chapter ''"ERP / Reference / Managing Triggers / Editing Triggers".'' | |
| − | + | ||
| − | + | ||
| Line 707: | Line 494: | ||
| − | + | ''The'' Edit Triggers ''dialog box is divided into different sections to convert tags to triggers, delete triggers, convert other event types like markers to triggers, and change trigger codes.'' Creating triggers for spectral processing using the artifact scan tool of the ERP paradigm is covered by a different dialog. | |
| − | + | ''Converting other event types to triggers'': This feature requires BESA Research 7.1 or higher. | |
| − | + | ==== Event Files ==== | |
| − | <span style="color:#3366ff;"><span style="color:#00000a;"> | + | BESA Research stores events in a binary event file in the program data base. However, it can be useful to be able to export, edit, or import events. The ERP module allows to export and import event files in ASCII format with the menu commands <span style="color:#3366ff;">'''ERP / Save Events As '''</span><span style="color:#3366ff;"><span style="color:#00000a;">and </span></span><span style="color:#3366ff;">'''ERP / Open Event File'''</span><span style="color:#3366ff;"><span style="color:#00000a;">. These event files can hold all types of events which occur during EEG or MEG recordings, e.g. triggers, comments, epochs, or tags. They can also be edited to change the type, latency, or number of events. For example, trigger events may be read in from an ASCII file, or the frequency of events of a certain type may be analyzed in a statistics software after exporting events.</span></span> |
| − | + | A detailed description of the features and the format of ASCII event files is given in the online help chapter "''Help / ERP / Reference / Managing Triggers / Working with Event Files''". | |
| − | + | ==== Tutorial 2: Creating Triggers from EMG ==== | |
| + | |||
| + | In this tutorial, myoclonic activity that was recorded via polygraphic channels is converted into trigger events. | ||
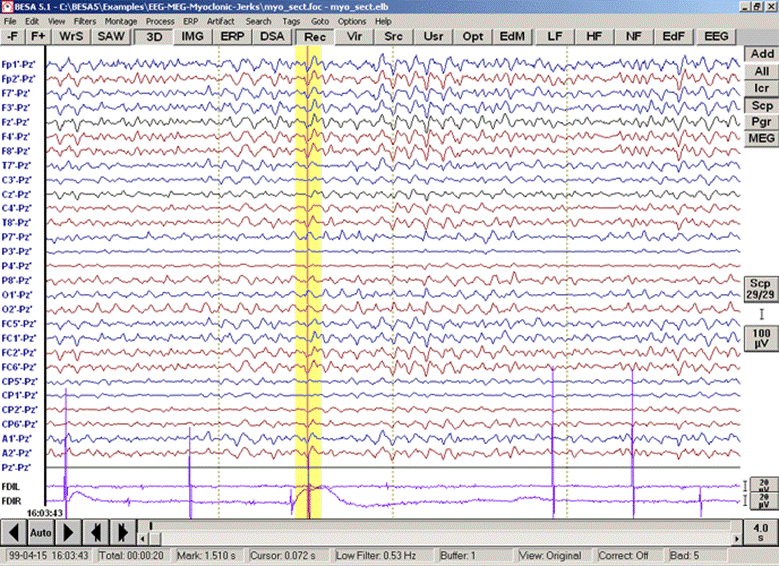
* <span style="color:#3366ff;"><span style="color:#00000a;">Open the MEG+EEG file segment "</span></span><span style="color:#ff9c00;">'''myo_sect.foc'''</span><span style="color:#3366ff;"><span style="color:#00000a;">" in the folder "</span></span><span style="color:#3366ff;"><span style="color:#00000a;">''Examples\EEG -MEG -Myoclonic-Jerks''</span></span><span style="color:#3366ff;"><span style="color:#00000a;">". We will only inspect EEG channels during this tutorial and select the two relevant EMG channels as additional channels. Press the "</span></span><span style="color:#3366ff;">'''Scp'''</span><span style="color:#3366ff;"><span style="color:#00000a;">" button to display only EEG channels. Set the time interval to 4s and switch off the high cutoff filter (choose menu entry </span></span><span style="color:#3366ff;">'''"Filters/High Cutoff Filter / High Cutoff Filter Off"'''</span><span style="color:#3366ff;"><span style="color:#00000a;"> or use the '</span></span><span style="color:#3366ff;">'''HF'''</span><span style="color:#3366ff;"><span style="color:#00000a;">' button). Press the '</span></span><span style="color:#3366ff;">'''Add' '''</span><span style="color:#3366ff;"><span style="color:#00000a;">button at the top right of the window and select the additional channel montage 'FDI-EMG'. The channels FDIL/FDIR which can be seen at the bottom of the window are the EMG channels recorded from the FDI muscles of the left and right hand.</span></span> | * <span style="color:#3366ff;"><span style="color:#00000a;">Open the MEG+EEG file segment "</span></span><span style="color:#ff9c00;">'''myo_sect.foc'''</span><span style="color:#3366ff;"><span style="color:#00000a;">" in the folder "</span></span><span style="color:#3366ff;"><span style="color:#00000a;">''Examples\EEG -MEG -Myoclonic-Jerks''</span></span><span style="color:#3366ff;"><span style="color:#00000a;">". We will only inspect EEG channels during this tutorial and select the two relevant EMG channels as additional channels. Press the "</span></span><span style="color:#3366ff;">'''Scp'''</span><span style="color:#3366ff;"><span style="color:#00000a;">" button to display only EEG channels. Set the time interval to 4s and switch off the high cutoff filter (choose menu entry </span></span><span style="color:#3366ff;">'''"Filters/High Cutoff Filter / High Cutoff Filter Off"'''</span><span style="color:#3366ff;"><span style="color:#00000a;"> or use the '</span></span><span style="color:#3366ff;">'''HF'''</span><span style="color:#3366ff;"><span style="color:#00000a;">' button). Press the '</span></span><span style="color:#3366ff;">'''Add' '''</span><span style="color:#3366ff;"><span style="color:#00000a;">button at the top right of the window and select the additional channel montage 'FDI-EMG'. The channels FDIL/FDIR which can be seen at the bottom of the window are the EMG channels recorded from the FDI muscles of the left and right hand.</span></span> | ||
| Line 723: | Line 512: | ||
| − | + | Mark a block that encloses a time interval where the feature occurs, e.g. an EMG discharge (jerk) in channel FDIL: | |
| − | + | ||
| − | + | ||
| Line 735: | Line 522: | ||
| − | |||
| − | |||
| − | |||
| − | |||
| − | |||
| − | |||
| − | |||
| − | |||
| − | |||
| − | |||
[[Image:ERP Processing (21).gif]] | [[Image:ERP Processing (21).gif]] | ||
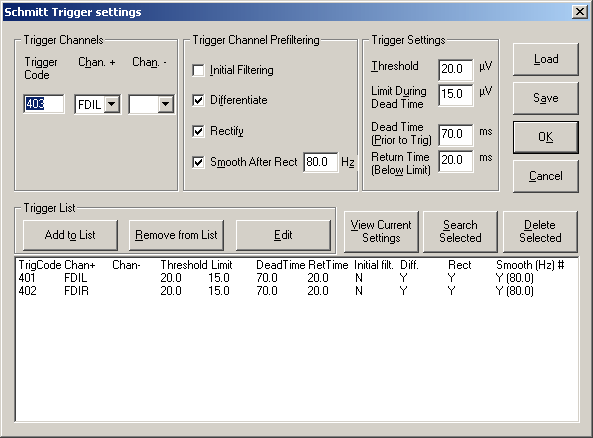
| − | + | Two definitions for triggers have already been set for comparison. They are listed in the list box at the bottom. | |
| − | + | Apart from the definition list, the box comprises three main sections. | |
| Line 763: | Line 540: | ||
| − | |||
| − | |||
| − | |||
| − | |||
| − | |||
| − | |||
| − | |||
| − | |||
| − | |||
| − | |||
| − | |||
| − | |||
| − | |||
| − | |||
| − | |||
| − | |||
| − | |||
| − | |||
| − | |||
| − | |||
| − | |||
| − | |||
| − | |||
[[Image:ERP Processing (22).gif]] | [[Image:ERP Processing (22).gif]] | ||
| Line 798: | Line 552: | ||
| − | |||
| − | |||
[[Image:ERP Processing (23).gif]] | [[Image:ERP Processing (23).gif]] | ||
| Line 811: | Line 563: | ||
| − | |||
| − | |||
[[Image:ERP Processing (24).gif]] | [[Image:ERP Processing (24).gif]] | ||
| − | * | + | * Choose the menu entry <span style="color:#3366ff;">'''Create Triggers from EMG/EEG'''</span> again. The dialog box automatically suggests a new trigger code. Choose the channel "FDIR" in the "Chan.+" combo box. Select the title bar in the list box at the bottom of the dialog box to make sure that no already defined trigger definition is selected. Click the button "<span style="color:#3366ff;">'''View Current Settings'''</span>". The thresholds have to be lowered to yield a picture like this (corresponding to upper and lower thresholds of 14.8 µV and 8.5 µV): |
| − | |||
| − | |||
[[Image:ERP Processing (25).gif]] | [[Image:ERP Processing (25).gif]] | ||
| − | * | + | * Click the button "<span style="color:#3366ff;">'''Search Selected'''</span>". Since no trigger definition is selected in the list box at the bottom of the dialog box, the settings which you have just entered are copied to the list box, and a search for myoclonic events in the FDIR channel is performed. For the settings quoted above, 17 trigger events are found. |
| − | < | + | If the file is opened again later and the menu entry <span style="color:#3366ff;">'''Create Triggers from EMG/EEG'''</span> is chosen, the settings made earlier are automatically loaded from file. It is also possible to load different files or to save the settings to a different filename using the "<span style="color:#3366ff;">'''Load'''</span>" and "<span style="color:#3366ff;">'''Save'''</span>" buttons. |
| − | + | '''Note''': If one of the entries in the list box other than the header line is selected, the button "<span style="color:#3366ff;">'''View current settings'''</span>" shows the settings of this particular entry. Since it is a fixed definition of a trigger, the thresholds cannot be changed graphically. | |
| − | + | For further information about conversion of EMG/EEG artifacts into trigger events, please consult the online help section in the Averaging Module Reference on "<span style="color:#3366ff;">''Strategies for Schmitt Trigger Definition''</span>". | |
| − | |||
[[Category:Research Manual]] | [[Category:Research Manual]] | ||
| + | |||
| + | |||
| + | {{BESAManualNav}} | ||
Latest revision as of 14:29, 5 May 2021
| Module information | |
| Modules | BESA Research Basic or higher |
| Version | BESA Research 6.1 or higher |
Contents
ERP Processing and Averaging
The Event-Related Potentials (ERP) Module - Introduction
The Event-Related Potentials (ERP) module provides many features that assist you with the analysis of event-related and evoked potentials and fields. These features, which are explained below, include
- defining triggers and conditions on the basis of experimental paradigms
- simultaneous averaging of multiple conditions
- viewing and analyzing averaged results in a Top Viewer window, e.g. for peak finding and measurement of amplitudes
- Grand Average and combining of conditions
- a Schmitt Trigger tool which makes it easy to convert EMG/EEG artifacts into trigger events
- a tool for editing triggers
- import and export of triggers from/to ASCII file
Coherence analysis is covered in the chapter on Source Coherence.
A comprehensive review of the features is given in the online help chapter "ERP / Reference". Detailed tutorials can be found in help chapter " ERP / Functions of the ERP module" under the corresponding section.
Paradigms for Averaging
Introduction
Paradigms allow to use scripting techniques for averaging of multiple recordings.
They keep track of all relevant settings for averaging and make it easy to perform all necessary steps for optimal averaging of the data with a few mouse clicks. Each experimental task is described by a condition, in which trigger events are selected for averaging on the basis of user-defined boolean statements. Conditions can later be combined, e.g. to create grand averages or to form different conditions.
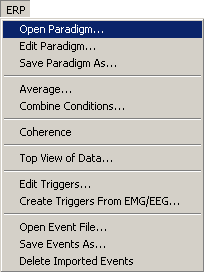
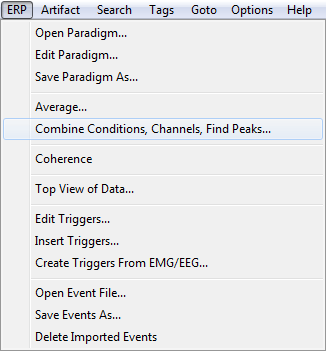
The process of editing paradigm definitions is started using the menu entries ERP / Open Paradigm or ERP / Edit Paradigm, or the ERP push button in the main window, as shown in the figure below.
Whereas Open Paradigm asks for a pre-defined paradigm file, Edit Paradigm opens the last used paradigm file for the current data set. If no paradigm is present, a new paradigm with default settings is created automatically. The ERP push button tries to open the last used paradigm file. If it does not exist, the File Open box appears.
The paradigm is defined using 6 (with Source Coherence Module 7) different dialog tabs. Each summarizes one aspect of the paradigm:
- Trigger: define trigger codes by assigning names and other attributes. Attributes (e.g. "intensity") help to group triggers.
- Condition: define a condition that selects trigger events from the experiment. Logical expressions can be combined to filter, for example, only the correct responses to a given task.
- Epoch: define epochs for averaging, baseline, artifact rejection, stimulus artifacts, and possibly a delay in trigger administration
- Filter: edit filter settings for averaging
- Artifact: reject artifacts by means of an interactive graphical rejection tool
- Average: select conditions for averaging and perform the average
- Coherence: specify settings for the time-frequency transformation (Source Coherence Module required)
Trigger
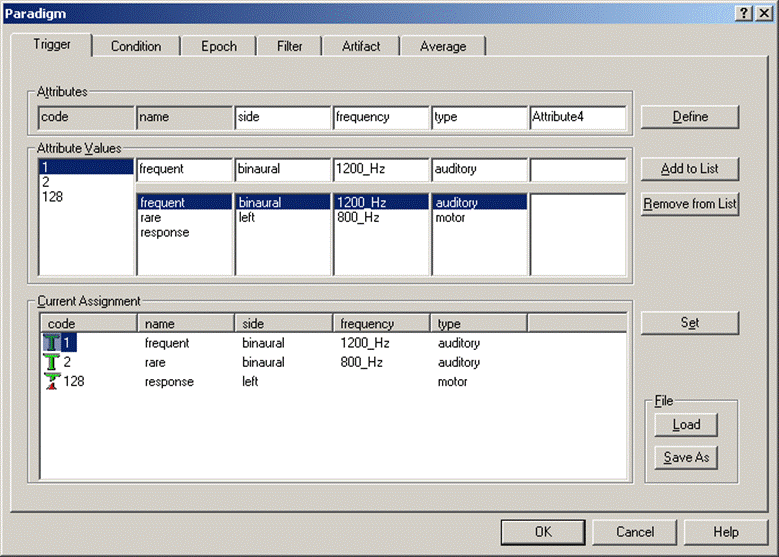
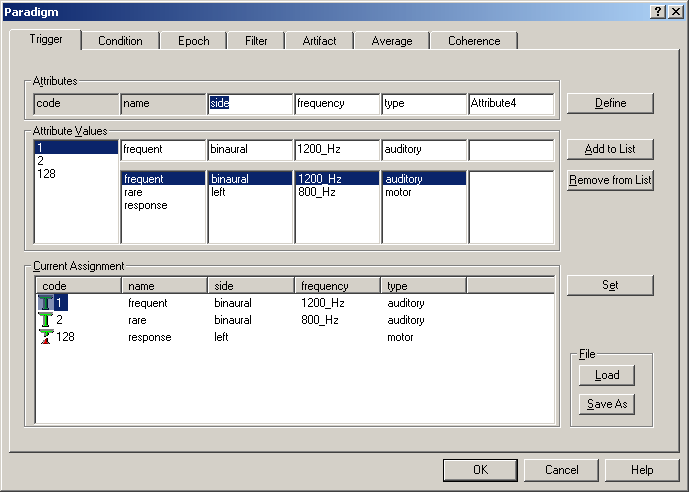
By default, triggers are defined by the trigger code. However, this definition is arbitrary and working with numbers instead of names is error-prone. The Trigger dialog tab in the Paradigm property sheet enables naming triggers and grouping triggers by making use of attributes. These attributes can be freely assigned, and each trigger obtains a unique definition for its attributes.
Generally, the suggested order in which to proceed for trigger definition is:
- Define the attributes which cover all the different sub-groups of triggers
- For each attribute, define the different values the attribute can take
- Define the triggers by selecting the code and the appropriate attribute values, and using the Set button
The Trigger dialog tab contains two main sections: The upper part is used to define attributes and attribute values for the triggers, whereas the lower part shows the current definitions.
For example, to assign names to the trigger codes:
- Enter names in the edit boxes of the Attribute Values section (below the attribute “name”)
- Add them to the list using the Add to List button.
- Define them by selecting code and name in the list box under the attribute “name” and clicking the Set button.
Trigger tab. The trigger codes are shown. The attribute “name” is defined automatically.
Condition
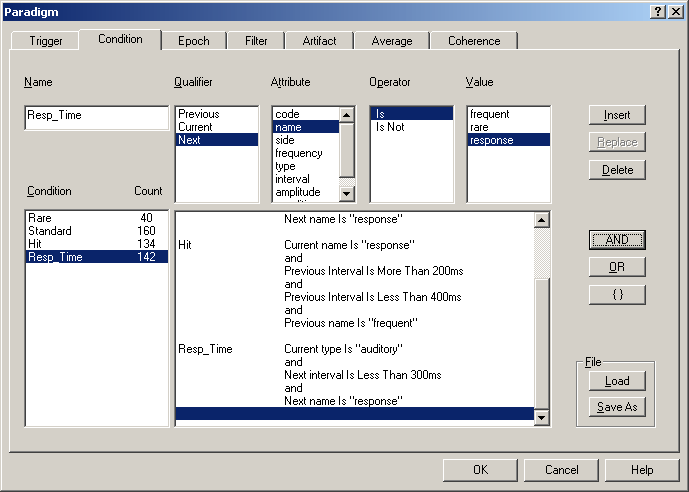
A condition holds all information connected with a task or a specific event type.
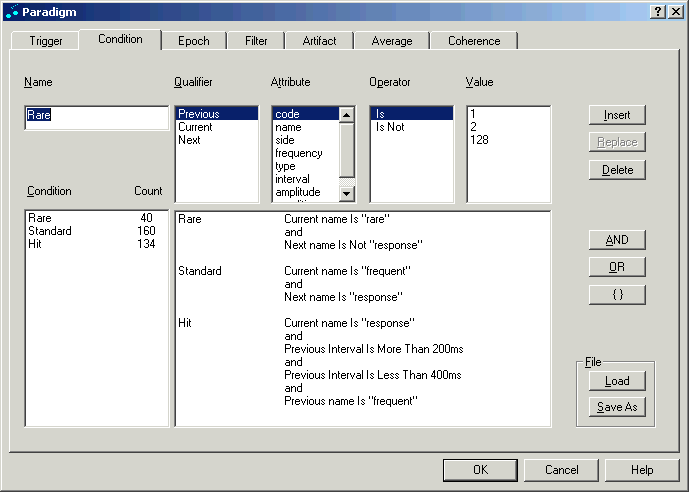
In the ERP module, averaging is performed on the basis of conditions. A condition is given by a logical expression that defines which trigger events are accepted for averaging. The "condition" tab makes it possible to define complex logic expressions and to see immediately how many matching trigger events result.
The example conditions shown in the figure below are defined in Tutorial 1: ‘Using a P300 Paradigm for Averaging ' in help chapter “ERP / Functions… / Paradigms for Averaging”, which gives a comprehensive overview of the features of the averaging module.
Editing a paradigm: Conditions can be defined by combining trigger definitions using boolean logic. This example shows definitions of three conditions (Rare, Standard, Hit) with a different number of matching events (40, 160, 134).
Epoch
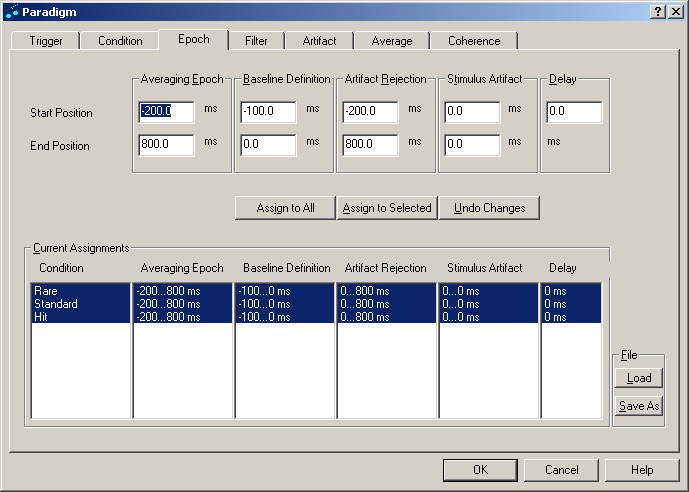
The dialog tab Epoch is used to set the epochs which define the averaging interval. For each condition, an individual set of epochs can be defined for averaging by the edit boxes at the top of the dialog tab. At the bottom of the tab, the current settings for all conditions can be viewed.
The push buttons in the center of the tab control the editing process. Two push buttons at the bottom right are for loading and saving a paradigm file.
Epoch tab. 4 different epochs can be defined for each condition. A stimulus delay time can also be specified.
Filter
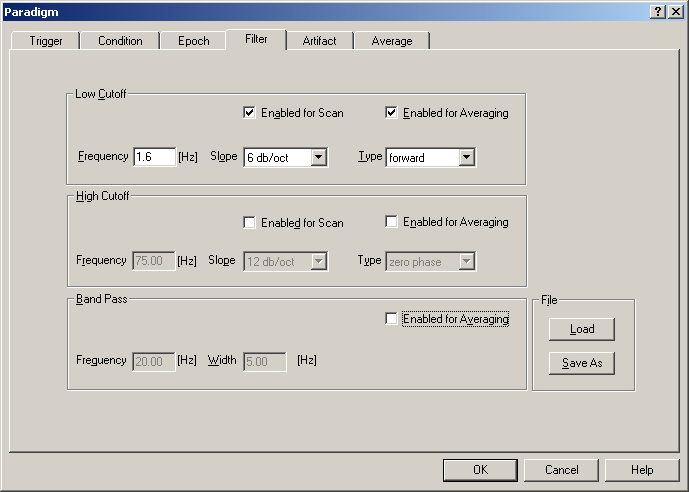
The Filter dialog tab allows you to change filter settings prior to averaging the data. The low and high pass filters can be chosen differently for the artifact scan and the average. Note: If the paradigm is edited for the first time, default filter settings are used. These can differ from the filter settings which you set in the review window. If a paradigm file was opened which does not contain filter settings, the filter settings which were chosen in the base module are displayed in the dialog tab.
Filter tab. Low cutoff, high cutoff, and band pass filters can be applied.
Artifact
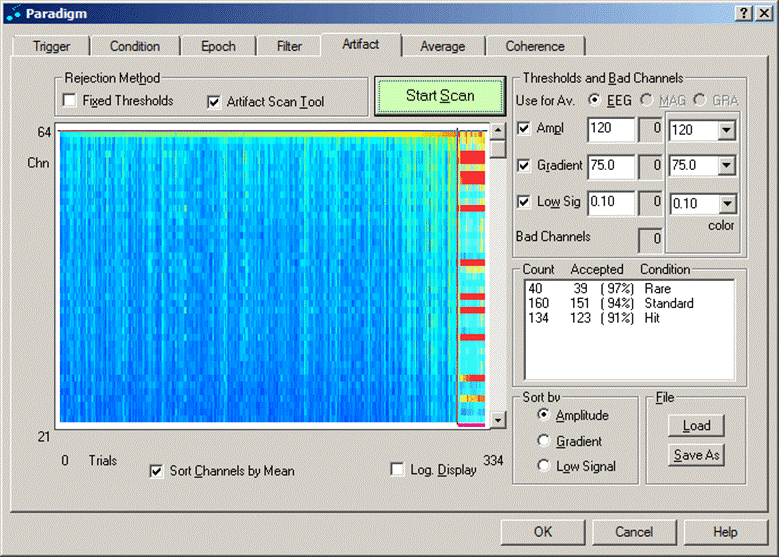
The Artifact dialog tab provides an easy way to define artifact rejection thresholds and to exclude bad channels and bad sweeps from the analysis. This is achieved by scanning the data file and then using the graphics display presented in the center of the dialog tab, which shows channels and sweeps sorted according to user-defined criteria.
If the user does not check any of the options Fixed Thresholds and Artifact Scan Tool, only regions that were explicitly marked as artifacts by the user will be excluded from the averages. If the option Fixed Thresholds is checked, the thresholds given in the edit boxes for amplitude and gradient are used to reject sweeps contaminated by artifacts.
The option Artifact Scan Tool provides an interactive tool for the comprehensive detection and rejection of both artifact-loaded channels and sweeps.
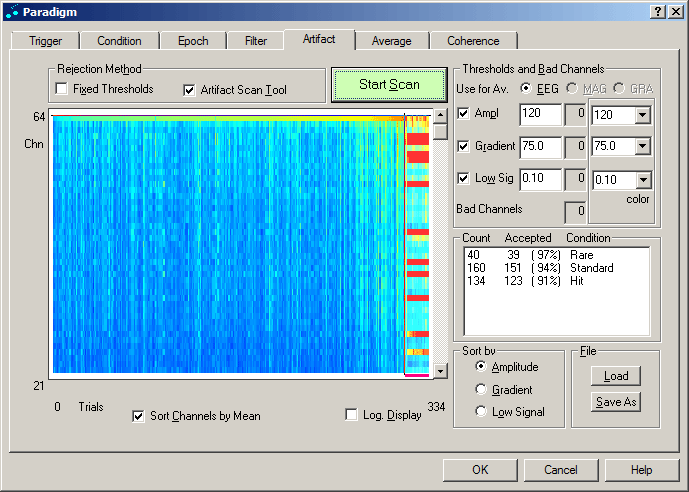
The figure below shows the result of an artifact scan. The trials are depicted in the columns of the display, sorted according to the highest amplitudes. Trials are rejected by mouse drag of the vertical cursor or by adjusting the rejection threshold for maximum amplitude, gradient, or minimum variance within a trial. The channels are depicted in the rows of the display, sorted according to the mean amplitude values over the trials. Similarly to excluding trials, a mouse drag of the horizontal cursor at the top of the display excludes channels.
Artifact scan result. The channel at the top shows significantly higher amplitudes than the rest, indicated by the lighter color. Trials in the rightmost columns have been excluded from averaging.
Average
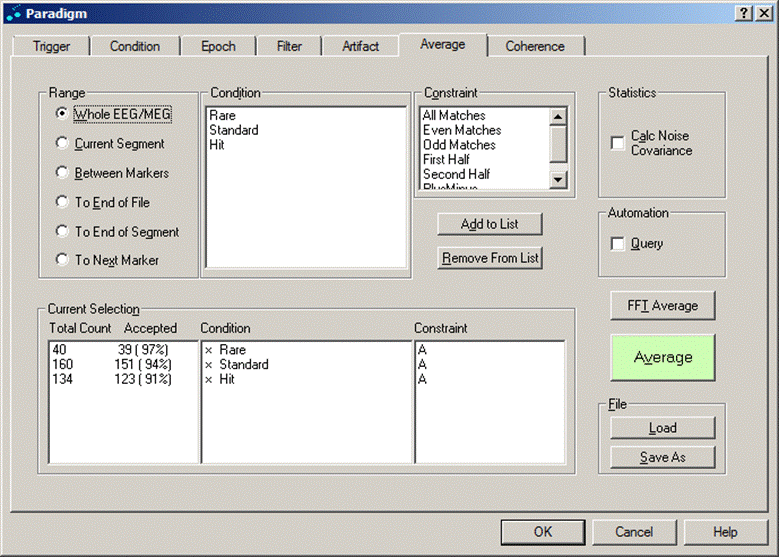
The Average dialog tab is used to define
- which conditions are averaged
- which range of the data file is searched for trigger events matching the conditions
- whether automatic or query search is performed
The left part of the Average tab contains radio buttons to select the search range within the data file.
The central part contains a list of available conditions and of available constraints for averaging.
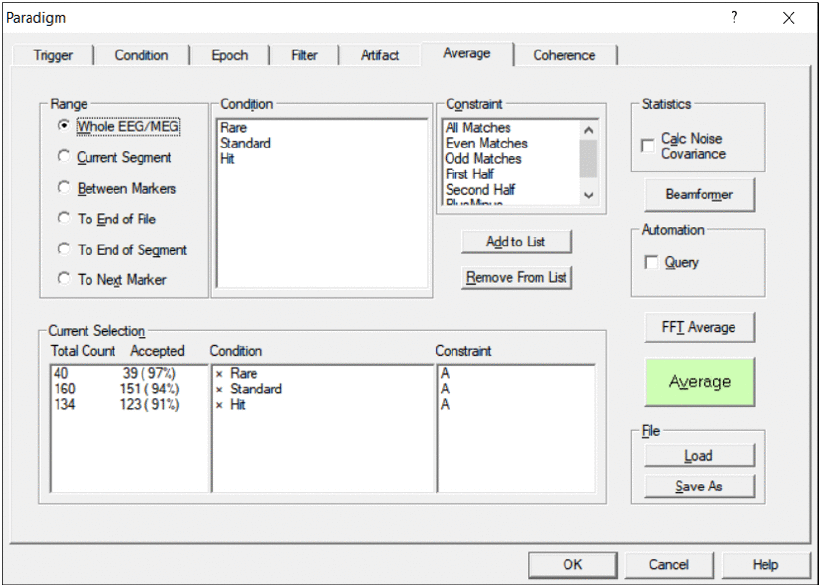
The list box array at the bottom shows the active and inactive conditions, the total number of matches, and the selected constraints. It provides an overview about the conditions which are selected. To add a condition to the list, select the condition and the constraint in the list boxes at the top, and click the Add to List button.
The right part contains additional sections for defining statistics and toggling between query averaging and automatic averaging.
Two push buttons at the bottom right are for loading and saving a paradigm file.
Averaging tab. Range, conditions, and constraints for split-half averaging can be adjusted.
The tutorial in help chapter "ERP / Functions... / Paradigms... / Tutorial 1: Using a P300 Paradigm for Averaging" gives an introduction to the available features. Different conditions can be combined to analyze experimental paradigms of high complexity.
A detailed description of the features can be found in the electronic help chapter "ERP / Reference / Using Paradigms to Average".
Tutorial 1: Using a P300 Paradigm for Averaging
This example illustrates how to define and evaluate experimental paradigms using the ERP module. We will work on an experiment with an auditory oddball paradigm. The paradigm involves frequent and rare tones of different pitch and a motor response. The following list shows the encoding of the three different events to triggers:
| File name | Triggers | Motor response to | |
| Freq-1200Hz-Resp-L.cnt | Frequent tone (1200Hz)
Rare tone (800Hz) Motor response (left hand) |
Trg. 1
Trg. 2 Trg. 128 |
frequent tone |
The electrode positions were digitized. The file with the extension Freq-1200Hz-Resp-L.sfp contains the digitized 3D coordinates for the EEG.
Follow the steps in the next section to see how the ERP module allows to customize the paradigm and to evaluate and average conditions.
A. Open a pre-defined paradigm
1. Load data
- Load data file "Freq-1200Hz-Resp-L.cnt" in the folder "Examples\ERP-P300-Auditory".
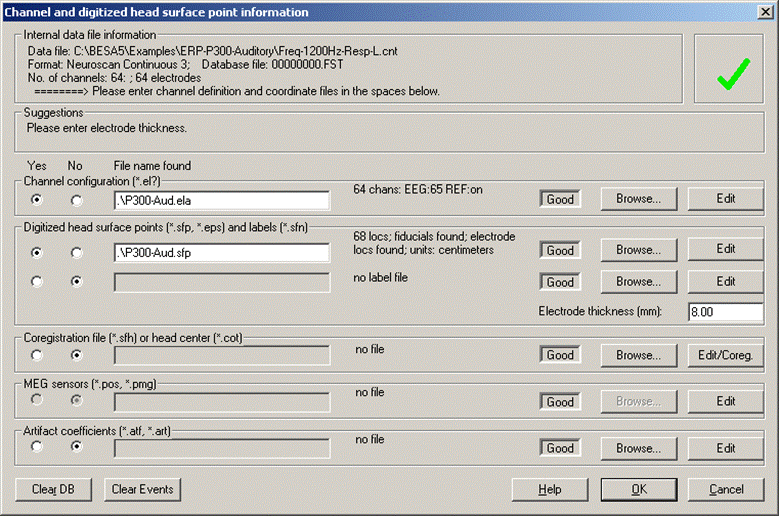
- Select File/Head Surface Points and Sensors/Load Coordinate Files... Browse for the coordinate files P300-Aud.ela and P300-Aud.sfp in the first two rows. They contain the type and location of the recorded electrodes. Enter '8mm' as electrode thickness, because in this example the coordinates specified in the sfp-file were measured 8mm away from the head surface.
2. Open a pre-defined paradigm definition
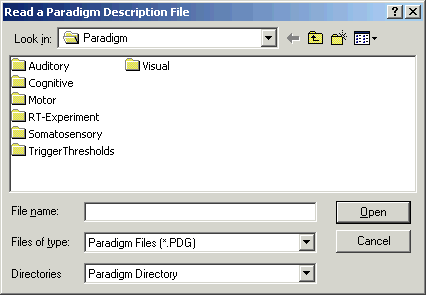
- Choose the menu entry ERP/Open Paradigm. A file selection box appears.
- Choose the folder "Auditory" and open the paradigm file "P300.PDG". Note that the combo box at the bottom of the file selection box enables a fast change between the default paradigm directory, and the directory where the data is stored.
The dialog box that appears consists of several pages ("tabs"). The tab which you see is divided into three sections. The list box on the left shows the current number of matches for all defined conditions. In this case, 3 conditions are defined:
- Rare
- Standard
- Hit
Upon reading the paradigm, the conditions were automatically evaluated. For all three conditions, matches were found.
- In the list box in the center of the page, the currently defined conditions are displayed. The right part contains the command buttons. We will learn more about them later.
- Leave the page by selecting the tab "Epoch" at the top.
B. Average conditions
1. Edit Averaging Epochs
All three lines are highlighted since they all hold the same epoch settings which were entered into the edit boxes in the top half of the tab.
The epoch which is used for calculating the baseline is set to -100 ms (start position) and 0 ms (end position) by default.
- Select the last condition "Hit" in the list by a single click with the left mouse button. The settings are automatically copied to the edit boxes. In the edit section, change the averaging epoch to -800 ms (start position) and +100 ms (end position). Click the button "Assign to Selected" which changes the epoch settings for this condition only. This allows you to average the pre-stimulus potentials for the motor response selectively. You will notice that the artifact rejection interval was also updated, to fit into the newly defined averaging interval. Before you move on to the tab "Filter", adjust the Baseline Definition Epoch to [-800 ms, -700 ms] and click the button "Assign to Selected".
2. Filter Settings
In the "Filter" tab, the low-frequency cutoff filter and the high-frequency cutoff filter can be edited.
- If the high cutoff filter is enabled for either artifact scan or averaging, disable it by clicking off the checkboxes. Switch to the "Artifact" tab.
3. Artifact Rejection
The artifact rejection tool offers two methods of artifact rejection. If the check box "Fixed Thresholds" is checked, the thresholds given at the right of the tab are used as limits that must not be exceeded in a trial. If the check box "Artifact Scan Tool" is checked, a scan of the data set is used to find artifacts.
- Press the green "Start Scan" button. The data file is scanned for artifacts. After the scan is completed, a color-coded representation of maximum signal in channels and trials appears. This scan only has to be performed once for a data file, unless conditions are changed. The next time the paradigm is opened with the "Edit Paradigm" command (cf. part C of this tutorial), the scan result will be available.
- The trials of the three active conditions are sorted according to their maximum amplitude from left to right. The red bar at the bottom indicates which of the trials are currently marked as artifacts due to their high amplitude. The channels are sorted according to the mean of the maximum amplitudes of the trials from bottom to top. Move the mouse pointer to the top of the display. The cursor changes to an up-down arrow. Click and drag the cursor down with the left mouse button to exclude the topmost channel, which carries an EKG artifact.
- Click on the button "Gradient" at the bottom of the dialog tab. The display changes to show the maximum gradients in the trials. The gradient is defined as the amplitude difference between two neighboring samples. Move the mouse pointer to the right edge of the display. When the cursor changes to a left-right arrow, click and drag the cursor to the left with the left mouse button to exclude the sweeps with the highest gradients, which are due to eye artifacts.
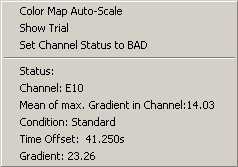
- At the new position of the dividing line which separates artifacts from good trials, press the right mouse button. A popup menu with information about the channel and trial at the cursor position appears.
- Choose the menu entry "Show Trial". The trial is displayed in the EEG. If it still carries an artifact, more sweeps should be excluded.
- For more information about the artifact scan tool, please refer to the corresponding reference section in the electronic help. Switch to the "Average" tab now.
4. Averaging
- At the bottom of the Average dialog tab, a list of currently selected conditions for averaging is shown. It already contains the three conditions for which matches were found in the EEG file. The right-most column indicates that all trigger events which matched the conditions will be averaged ("A").
- Double-click on the condition "Hit" in the list box at the bottom. The cross in front of the condition name disappears, which indicates that this condition will not be averaged. Double-click it again to activate averaging of the condition again.
- Click the green button "Average" on the right to start averaging. The progress is shown in an information window.
To cancel the averaging process, press any key. A message box appears. If you choose "No" averaging is continued. Choosing "Yes" stops the averaging process and asks you for a file name for each condition. After saving, the new averaged file is opened and the averaged segments are automatically displayed in the Top Viewer window. If you choose "Cancel", the results for the condition are not saved.
C. Edit a pre-defined paradigm
1. Load data and paradigm file
- With file "Freq-1200Hz-Resp-L.cnt" open, choose menu entry ERP/Edit Paradigm, which opens the paradigm again (the copy of the paradigm file that was stored in the data directory), including the changes which were made in the last session.
2. Edit trigger definition
- Choose the tab "Trigger" on the top left. You now see the definition of triggers in the list view box at the bottom.
- The top half of the tab contains the edit section. In the top row, attributes which describe experimental categories can be defined or deleted. The next row shows the attribute values which are available. The values which are currently active for the selected trigger code (left) are highlighted.
- Trigger code 128 does not have a proper definition for the attribute "frequency". To change the definition:
- In the list box below the attribute "code" (left), choose code 128.
- In the edit box below the attribute "frequency", type in "undefined". Click the push button "Add to List" on the righthand side, which adds the new value into the list box and selects it automatically.
- Click the button "Set" to set the new definition for trigger code 128.
- Alternatively: right-click with the mouse directly on the value which you want to change in the list view box at the bottom of the tab. See what happens... (more information about defining triggers can be found in the electronic help reference section).
- The definition for trigger 128 has changed. Choose the tab "Condition" (top of the page) to get back to the condition page.
3. Edit conditions
- Switch to the 'Condition' tab. Select the last line of the condition edit list box (center of page) by a single click with the left mouse button. The name of the condition appears in the top left corner of this section of the page.
You can edit the name in the name edit field, and rename the condition by clicking the "Replace"" button.
Now we will add a new condition that links the standard stimulus with a response time: A new condition is defined as follows: In the name field, type in a new name, e.g. "Resp_Time".
In the list box "Qualifier", select "CURRENT".
In the list box "Attribute", select "type".
In the list box "Operator", select "IS".
In the list box "Value", select "auditory".
Click the "Insert" button to start up the new condition. The name is automatically assigned to the new condition.
In the list box "Qualifier", select "NEXT".
In the list box "Attribute", select "Interval".
In the list box "Operator", select "IS LESS THAN".
In the edit box that appeared under "Value", type 500.
Click the "AND" button to extend the condition.
In the list box "Qualifier", select "NEXT".
In the list box "Attribute", select "name".
In the list box "Operator", select "IS".
In the list box "Value", select "response".
Finish off the condition by clicking the "AND" button again.
- The new condition is automatically evaluated. 160 matches are found, i.e. in all cases, the response was within 500 ms.
- Select the line "Next.Interval IS LESS THAN 500 ms" in the condition. Enter the value "300" in the edit box at the top right of the tab and click the "Replace" button. The condition changes accordingly and is re-evaluated. Only 142 matches are found now.
- If you leave the dialog box with the "OK" button, the settings are automatically stored in the data directory if the directory is writeable. If you choose the menu entry ERP/Edit Paradigm in the future, this specific definition will be opened.
- Choose ERP/Average again. You will see that four conditions are selected for averaging. The newly defined condition is active. If you just want to compare the condition "Resp_Time" with the one that did not have a time limit ("Standard"), select the other two entries (by holding down the "CTRL" button on the keyboard while selecting) and click the button "Remove from List" to remove these conditions from the averaging list. Only two conditions are now active for averaging.
Top View of Data Segments
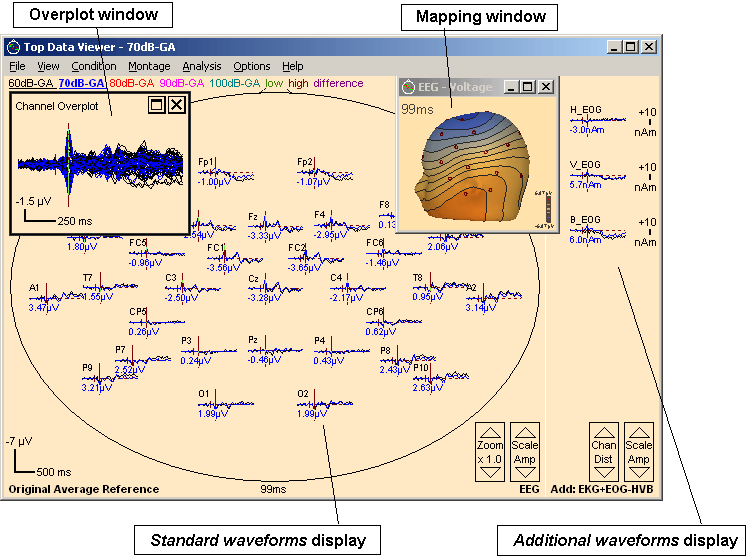
Any EEG or MEG data segment can be viewed and analyzed in the Top View window. Waveforms are arranged according to their position on the head. The various options include peak finding, analysis and annotation, 3D mapping of amplitude or current source density, overplot of several conditions, and many more.
A detailed description of the features is given in online help chapter “ERP / Reference / Viewing and Analyzing Data in the Top View”.
Topographic view of averaged data in a 32-channel auditory evoked ERP experiment. Two conditions are overplotted. A map of the N100 in one condition is shown. Channel amplitudes at the N100 latency are displayed
To view a segment or a set of segments in the Top View window, right-click on the segment waveforms and select Top View from the popup menu that appears. The Top Viewer window comes up, displaying the first segment in the data file. To switch to another segment, click on the segment name in the top line; select several segments for overplot by holding down the <CTRL> key while clicking on the segment names. Note that even if several conditions are shown, only one condition is active for analysis. The active condition is indicated by bold print in the top line, and in the title bar of the window.
Measuring peaks and amplitudes
Note: There are powerful tools for peak and amplitude analysis and export in the Combine Conditions, Channels, Find Peaks Module.
Peaks
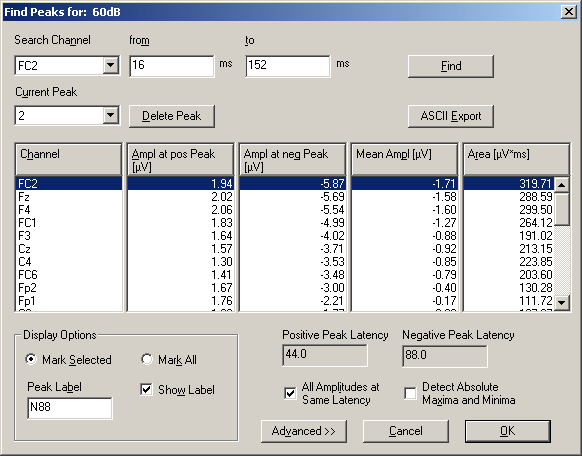
To measure peaks and peak areas in the Top Viewer, right-click into a waveform between the baseline and the peak, and select the option Find and Mark Peak from the popup menu. If the peak is small, operate on the zoomed waveform: Right-click onto the waveform, select Zoom Waveform from the popup menu and then proceed to mark the peak. The Peak Finding dialog box appears and shows the result of the peak search:
Result of a peak search in the waveform of electrode T3 of a single epileptic spike. The peak amplitude is -50.7 µV. The peak latency is 5 milliseconds after the mid-latency of the search pattern.
A peak search can also be initiated from the menu entry Analysis / Find Peaks. The search channel and time range can then be specified in the top row of the dialog box. Click the Find button to start the search.
Please refer to the online help Reference chapter for a detailed description of the peak finding tool.
Waveform amplitudes
To display amplitudes at specific latencies, double-click on a waveform and drag the cursor to the desired latency or use the left-right arrow keys on the keyboard. The latency is displayed at the bottom of the window, and a 3D map appears in the top right corner. From the View menu, select the Preferences option. In the dialog box which appears, select the tick marks Show Labels and Show Amplitudes:
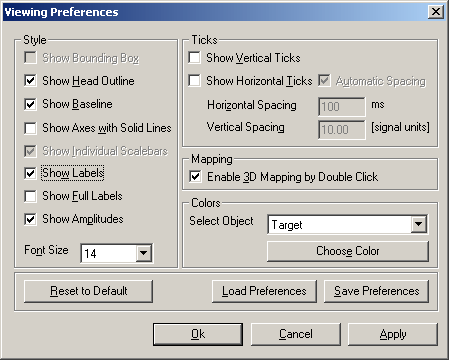
Please note: Peak latencies and amplitudes can be determined over multiple files in a quick automatized way using scripts. Please refer to Chapter "Batch Processing and Combining Conditions / Combine Conditions".
Montages
The displayed montage in the Top Viewer can be any arbitrary montage. Peak amplitudes are automatically adapted to the currently applied montage. When the Top Viewer window opens, the montage selected in the BESA Research main window is selected by default. Use the Montage menu or click on the text at the bottom left to switch to another montage.
Advanced viewing options
Further options include:
- Moving waveforms in the display, zooming individual channels, hiding channels, zooming the whole display.
- Selecting only a part of the epoch for display.
- 3D whole head mapping of voltage or current source density.
- Changing display options such as tick marks, channel labels, baseline information, font sizes, colors, and more.
- Display of standard deviations, and event-related (de-)synchronization (this requires bandpass filtering of the data during averaging, see the corresponding help chapter).
Please refer to the online help chapter “ERP / Reference / Viewing and Analyzing Data in the Top View for more information.
Grand Averaging and Combining Conditions
The ERP Module allows for a quick combination of averaged segments, e.g. to create Grand Averages over subjects or to compute weighted sums and differences of conditions.
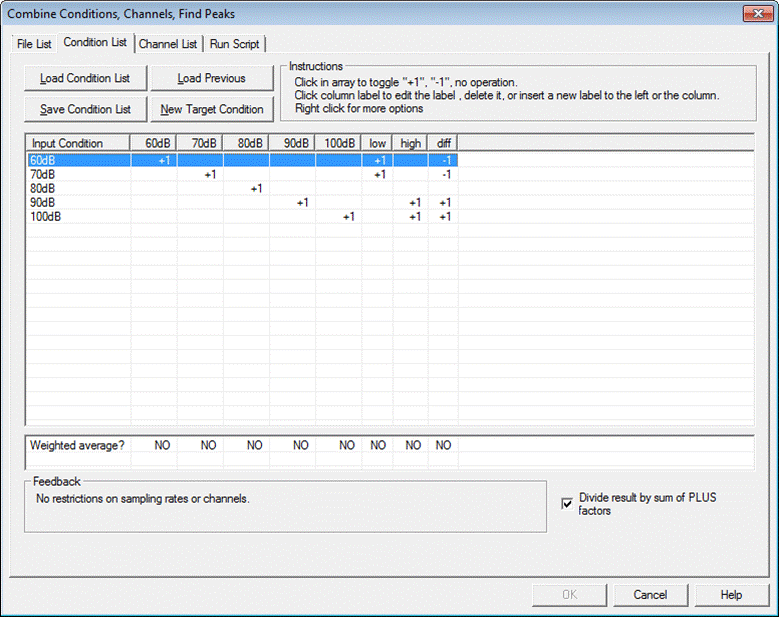
Conditions from different recordings/subjects can be combined in a convenient way using scripts. The menu entry "ERP/Combine Conditions, Channels, Find Peaks" allows for grand averaging and creating sums and differences between conditions. It also provides a tool for spatial and temporal resampling, and allows to perform an automatic peak analysis of multiple averaged files. For a detailed description of the 'Combine Conditions, Channels, Find Peaks' functions, please refer to the help chapter "Batch Processing and Combining Conditions / Combine Conditions".
Managing Triggers
Creating Triggers from EMG/EEG Channels
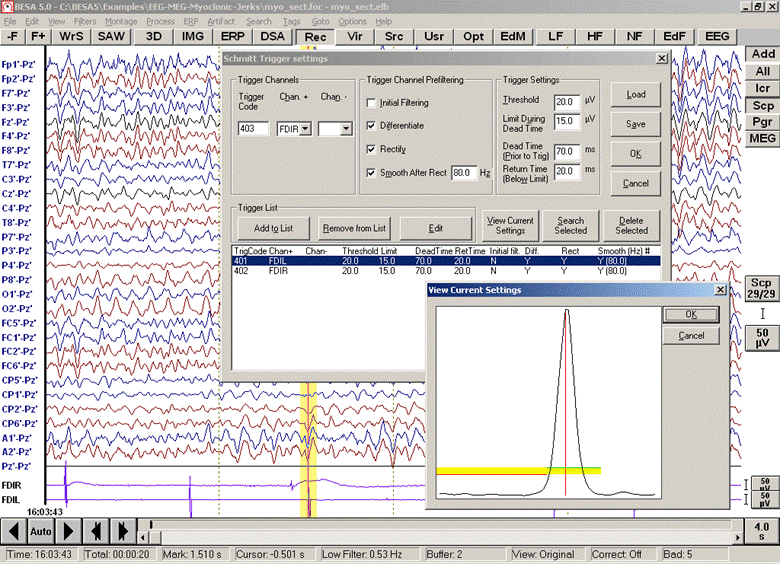
It is possible to create new trigger events from any of the recorded channels. This is achieved by defining parameters that characterize the features of the event. After the parameters are defined, the whole EEG /MEG is searched for events which match the parameters, and new trigger events are created. The steps to be taken are illustrated in the help tutorial chapter "ERP / Functions... / Managing Triggers / Tutorial 2: Creating Triggers from EMG".
Briefly, the procedure to create triggers for a recurring pattern is as follows:
1. Mark a typical occurrence of the pattern by left mouse drag.
2. Use menu item ERP / Create Triggers from EMG/EEG to open the Schmitt Trigger dialog box.
3. In the dialog box, select the channel you want to scan for triggers under Chan+. In most cases, it is advisable to go through section Trigger Channel Prefiltering and check the tick marks Differentiate, Rectify, Smooth After Rect and enter a value between 50 Hz and 100 Hz for the smoothing frequency (see figure below).
4. Set the Schmitt Trigger parameters. The Schmitt Trigger is characterized by 4 parameters:
- Threshold (upper threshold): the threshold that the signal has to exceed
- Limit During Dead Time (lower threshold): the threshold that the signal must not exceed during the dead time before the trigger
- Dead Time (Prior to Trig): the time interval before the trigger where the signal must be lower than the lower thresholds
- Return Time (Below Limit): the time during which the signal has to return below the threshold
Click the button View Current Settings. In the window that pops up, use the mouse drag to adjust the edges of the yellow block so that the lower threshold is above the pre-trigger baseline, and that the higher threshold stays well under the peak (vertical mouse dragging). Adjust the pre-trigger dead time (length of block left of the red line) which prevents recognizing each threshold crossing in a burst as trigger event, and the return time (horizontal mouse dragging).
5. Click OK. The parameters are updated in the Schmitt Trigger dialog box.
6. Click the buttons Add to List and Search Selected to start the trigger search.
Triggers can be deleted again by calling the Schmitt Trigger dialog box again, selecting the corresponding entry in the list box, and clicking the Delete Selected button. Triggers can also be deleted using the Edit Triggers command (see next section).
A complete reference of the features is given in the online help chapter "ERP / Reference / Managing Triggers / Creating Triggers". An advanced topic explains the use of different filter settings using a myoclonic burst as an example (Strategies for Schmitt Trigger definition).
Tutorial 2: Creating Triggers from EMG
The waveform of a trigger channel can be rectified and filtered to define trigger events. In the example above, the EMG channel FDIL is scanned for myoclonic discharges. The small window shows the waveform of the marked epoch after appropriate filtering.
Editing Triggers
Patterns, tags, and markers can be converted into trigger events using the Edit Triggers tool. After conversion, tags found in a pattern search can be used in conditions: they can be analyzed by the paradigm tool which controls and stores the complete pre-averaging process. This facilitates for example the averaging of epileptic spikes which were hand-marked or found by a pattern search (cf. chapter "Review / Searching and Averaging").
The Edit Triggers tool is also useful to delete triggers which were created earlier, to change trigger codes, or to create triggers for FFT averaging with graphical artifact rejection on the basis of the paradigm tool.
A detailed description of the features is given in the online help chapter "ERP / Reference / Managing Triggers / Editing Triggers".
The Edit Triggers dialog box is divided into different sections to convert tags to triggers, delete triggers, convert other event types like markers to triggers, and change trigger codes. Creating triggers for spectral processing using the artifact scan tool of the ERP paradigm is covered by a different dialog.
Converting other event types to triggers: This feature requires BESA Research 7.1 or higher.
Event Files
BESA Research stores events in a binary event file in the program data base. However, it can be useful to be able to export, edit, or import events. The ERP module allows to export and import event files in ASCII format with the menu commands ERP / Save Events As and ERP / Open Event File. These event files can hold all types of events which occur during EEG or MEG recordings, e.g. triggers, comments, epochs, or tags. They can also be edited to change the type, latency, or number of events. For example, trigger events may be read in from an ASCII file, or the frequency of events of a certain type may be analyzed in a statistics software after exporting events.
A detailed description of the features and the format of ASCII event files is given in the online help chapter "Help / ERP / Reference / Managing Triggers / Working with Event Files".
Tutorial 2: Creating Triggers from EMG
In this tutorial, myoclonic activity that was recorded via polygraphic channels is converted into trigger events.
- Open the MEG+EEG file segment "myo_sect.foc" in the folder "Examples\EEG -MEG -Myoclonic-Jerks". We will only inspect EEG channels during this tutorial and select the two relevant EMG channels as additional channels. Press the "Scp" button to display only EEG channels. Set the time interval to 4s and switch off the high cutoff filter (choose menu entry "Filters/High Cutoff Filter / High Cutoff Filter Off" or use the 'HF' button). Press the 'Add' button at the top right of the window and select the additional channel montage 'FDI-EMG'. The channels FDIL/FDIR which can be seen at the bottom of the window are the EMG channels recorded from the FDI muscles of the left and right hand.
- By clicking on the scaling button on the bottom right of the screen, adjust the voltage of the additional channels to 20 µV.
Mark a block that encloses a time interval where the feature occurs, e.g. an EMG discharge (jerk) in channel FDIL:
- From the ERP menu, select "Create Triggers from EMG/EEG". The Schmitt Trigger settings dialog box appears.
- Press the 'Load' button and open the pre-defined trigger definition 'EMG-Jerks.smt'.
Two definitions for triggers have already been set for comparison. They are listed in the list box at the bottom.
Apart from the definition list, the box comprises three main sections.
- In the section "Trigger Channels" choose a trigger code which you want to assign to the EMG artifact. As a default setting, the code 403 is suggested. In this example, accepted this default.
- Select the channel that contains the information (FDIL) in the "Chan. +" dropdown list.
- If you want to reference the channel against another channel, choose a reference channel from the "Chan. –" dropdown list. This is not necessary here.
- In the section "Trigger Channel Prefiltering" check the respective options if you want the channel pre-filtered according to the current filter settings ("Initial Filtering"), differentiated, rectified, and smoothed with an additional low-pass filter after rectification. Check the options 2, 3, and 4 (all except "Initial Filtering"). The cut-off frequency for the smoothing can be adjusted manually. Try 70 Hz as the smoothing frequency.
- Click the button "View Current Settings" to view the effect of the current filter settings on the signal in the specified channel. In our example, the result looks like this:
- The yellow rectangle denotes the parameters which define whether the signal is accepted as a trigger event. Four parameters can be varied:
- The top edge of the rectangle denotes the threshold which must be exceeded by the signal (green line).
- The bottom edge of the rectangle denotes the pre-trigger threshold which must not be exceeded by the signal prior to the trigger event (red line). This ensures that in the case of multiple trigger events, events are excluded which may contain contributions from previous triggers.
- The left edge denotes the "dead time" prior to the trigger event during which no other event is allowed to occur.
- The right edge denotes the "return time" during which the signal must return below the bottom edge. If the event shows a slow decay, it is excluded. This prevents merged multiple events to be included.
- Drag the bottom and the top of the rectangle up with the left mouse button to increase the thresholds. The result can look like this:
- Clicking the OK button leads back to the dialog box, where the four parameters (shown in the section "Trigger Settings") have now been adjusted. By typing in the values manually, adjust the threshold to 40 µV, the limit during dead time to 25 µV, the dead time to 70 ms, and the return time to 30 ms.
- Click the button "Add to List" to complete the definition of the trigger event.
- Click the button "Search Selected" to search the file for occurrences of the trigger event. After the end of the search, the number of detected trigger events is given in the list box. In this example, 39 trigger events were found.
- Leave the dialog box with "OK". The current settings are automatically saved in a file with the filename of the data file with the extension "SMT".
- Press the 'SCP' button again and page forward in the file using the space bar. In the screen that appears, mark a relatively small myoclonic signal in the FDIR channel:
- Choose the menu entry Create Triggers from EMG/EEG again. The dialog box automatically suggests a new trigger code. Choose the channel "FDIR" in the "Chan.+" combo box. Select the title bar in the list box at the bottom of the dialog box to make sure that no already defined trigger definition is selected. Click the button "View Current Settings". The thresholds have to be lowered to yield a picture like this (corresponding to upper and lower thresholds of 14.8 µV and 8.5 µV):
- Click the button "Search Selected". Since no trigger definition is selected in the list box at the bottom of the dialog box, the settings which you have just entered are copied to the list box, and a search for myoclonic events in the FDIR channel is performed. For the settings quoted above, 17 trigger events are found.
If the file is opened again later and the menu entry Create Triggers from EMG/EEG is chosen, the settings made earlier are automatically loaded from file. It is also possible to load different files or to save the settings to a different filename using the "Load" and "Save" buttons.
Note: If one of the entries in the list box other than the header line is selected, the button "View current settings" shows the settings of this particular entry. Since it is a fixed definition of a trigger, the thresholds cannot be changed graphically.
For further information about conversion of EMG/EEG artifacts into trigger events, please consult the online help section in the Averaging Module Reference on "Strategies for Schmitt Trigger Definition".
| Review | |
|---|---|
| Source Analysis | |
| Integration with MRI and fMRI | |
| Source Coherence | |
| Export | |
| MATLAB Interface | |
| Special Topics | |
