Difference between revisions of "Source Coherence Introduction and Concepts"
| Line 7: | Line 7: | ||
== Source Coherence Module - Introduction == | == Source Coherence Module - Introduction == | ||
| − | The Source Coherence Module provides new insights into interaction between brain regions using brain source montages. These are derived from multiple source models of the data. Transforming the scalp surface into the brain signals using source montages greatly enhances the spatial resolution and largely removes one of the major drawbacks of traditional coherence analysis, the widespread overlap at the scalp due to volume conduction. | + | The Source Coherence Module provides new insights into the interaction between brain regions using brain source montages. These are derived from multiple source models of the data. Transforming the scalp surface into the brain signals using source montages greatly enhances the spatial resolution and largely removes one of the major drawbacks of traditional coherence analysis, the widespread overlap at the scalp due to volume conduction. |
The Source Coherence Module provides a variety of tools for time-frequency based event-related data analysis. | The Source Coherence Module provides a variety of tools for time-frequency based event-related data analysis. | ||
| Line 21: | Line 21: | ||
* Export of analysis results into ASCII text files | * Export of analysis results into ASCII text files | ||
| − | Time-frequency transforms are obtained in a very fast implementation based on complex demodulation. Apart from source channels, intracranial channels, and scalp channels, also other polygraphic channels, e.g. rectified EMG, can be included | + | Time-frequency transforms are obtained in a very fast implementation based on complex demodulation. Apart from source channels, intracranial channels, and scalp channels, also other polygraphic channels, e.g. rectified EMG, can be included in the analysis. |
| − | A highly optimized graphical user interaction enables | + | A highly optimized graphical user interaction enables fast testing of hypotheses, and quick focusing on the features of interest. |
For an introduction and an outline of the underlying concepts of source coherence, please continue with the next topic, "[[Source_Coherence_Introduction_and_Concepts#Concepts_of_Source_Coherence|''Concepts of Source Coherence'']]" | For an introduction and an outline of the underlying concepts of source coherence, please continue with the next topic, "[[Source_Coherence_Introduction_and_Concepts#Concepts_of_Source_Coherence|''Concepts of Source Coherence'']]" | ||
| Line 40: | Line 40: | ||
* Surface waveform: a time signal recorded from EEG-electrodes or MEG sensors | * Surface waveform: a time signal recorded from EEG-electrodes or MEG sensors | ||
* Source waveform: a time signal calculated for a specified brain region or cortical surface | * Source waveform: a time signal calculated for a specified brain region or cortical surface | ||
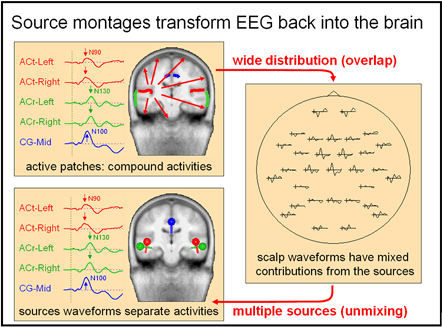
| − | * Source montage: transformation of the on-going EEG into the estimated contributions or source waveforms of a set of brain regions | + | * Source montage: the transformation of the on-going EEG into the estimated contributions or source waveforms of a set of brain regions |
[[Image:SourceCoh Concepts (1).gif ]] | [[Image:SourceCoh Concepts (1).gif ]] | ||
| Line 53: | Line 53: | ||
* TSE: temporal spectral evolution, change in amplitude or power over time relative to the baseline interval | * TSE: temporal spectral evolution, change in amplitude or power over time relative to the baseline interval | ||
* ERD/ERS: event-related (de)-synchronization, used as a synonym for TSE | * ERD/ERS: event-related (de)-synchronization, used as a synonym for TSE | ||
| − | * ERSP: event-related spectral perturbations, change in power or amplitude over time. This is the more general term and comprises ERD/ERS/TSE that | + | * ERSP: event-related spectral perturbations, change in power or amplitude over time. This is the more general term and comprises ERD/ERS/TSE that is related to baseline. |
* Correlation: correlation between two time signals, i.e. scalar product of normalized signals in time domain | * Correlation: correlation between two time signals, i.e. scalar product of normalized signals in time domain | ||
| Line 85: | Line 85: | ||
=== Source Coherence === | === Source Coherence === | ||
| − | An optimal separation is obtained by a source montage derived from a multiple source model. The model is used to create an inverse spatial filter, i.e. a source montage that separates the different brain activities. Activities that are not accounted for by the model, e.g. from background noise or EEG, are distributed amongst the sources and may therefore lead to 'noise coherence' between source channels. This 'noise coherence' can be large for sources | + | An optimal separation is obtained by a source montage derived from a multiple source model. The model is used to create an inverse spatial filter, i.e. a source montage that separates the different brain activities. Activities that are not accounted for by the model, e.g. from background noise or EEG, are distributed amongst the sources and may therefore lead to 'noise coherence' between source channels. This 'noise coherence' can be large for sources that have very similar spatial topographies. It can be reduced by increasing the regularization constant of the inverse at the expense of a larger cross-talk between the sources or by including specific sources accounting for the 'noise'. |
| − | The principal steps to calculate a time-frequency diagram and source coherence are illustrated in the figure below for the real data example of error-related negativity (ERN). A multiple source model is created from averaged ERP data and/or sources in brain regions known to contribute from fMRI/PET studies using a similar task. The source model is then used to calculate a source montage and the source waveforms of the single trials. Next, | + | The principal steps to calculate a time-frequency diagram and source coherence are illustrated in the figure below for the real data example of error-related negativity (ERN). A multiple source model is created from averaged ERP data and/or sources in brain regions known to contribute from fMRI/PET studies using a similar task. The source model is then used to calculate a source montage and the source waveforms of the single trials. Next, every single trial is transformed into the time-frequency domain by selecting a certain temporal resolution using complex demodulation (a principle similar to FM radio). From the single trials, time-frequency displays are generated by averaging spectral density amplitude or power over trials. Source coherence is calculated by averaging the cross-spectral density of one reference channel with all other channels over trials and normalizing by the averaged auto-spectral densities (cf. figure above). |
Latest revision as of 15:46, 5 May 2021
| Module information | |
| Modules | BESA Research Complete |
| Version | BESA Research 6.1 or higher |
Contents
Source Coherence Module - Introduction
The Source Coherence Module provides new insights into the interaction between brain regions using brain source montages. These are derived from multiple source models of the data. Transforming the scalp surface into the brain signals using source montages greatly enhances the spatial resolution and largely removes one of the major drawbacks of traditional coherence analysis, the widespread overlap at the scalp due to volume conduction.
The Source Coherence Module provides a variety of tools for time-frequency based event-related data analysis.
- Time-frequency diagrams based on brain source or surface channels
- Display of temporal-spectral evolution (TSE) in percent
- Separation of evoked and induced activity
- Joint display of time-frequency or coherence plots with the evoked potential of individual channels
- Coherence estimate between any combination of surface or source channels (coherence or phase coherence)
- Computation and display of phase delay and latency difference between channels in a graphically defined time and frequency window
- Display of the inter-trial phase locking (ITPL)
- Comparison of two conditions
- Probability plots transforming all time-frequency parameters into statistical p-values
- Export of analysis results into ASCII text files
Time-frequency transforms are obtained in a very fast implementation based on complex demodulation. Apart from source channels, intracranial channels, and scalp channels, also other polygraphic channels, e.g. rectified EMG, can be included in the analysis.
A highly optimized graphical user interaction enables fast testing of hypotheses, and quick focusing on the features of interest.
For an introduction and an outline of the underlying concepts of source coherence, please continue with the next topic, "Concepts of Source Coherence"
For more details check the following topics:
- Layout of the Source Coherence Window
- Reference (in the BESA help)
Please also refer to our website at http://www.besa.de for the latest tutorial on source coherence and related topics.
Concepts of Source Coherence
Recently, an increasing number of papers on oscillatory coupling between brain regions in animal studies and on time-frequency analysis of human EEG and MEG data has been published. BESA Research introduces several tools for fast and user-friendly time-frequency analysis including source and scalp coherence.
First, let us introduce some terminology in order to clarify the concepts:
- Surface waveform: a time signal recorded from EEG-electrodes or MEG sensors
- Source waveform: a time signal calculated for a specified brain region or cortical surface
- Source montage: the transformation of the on-going EEG into the estimated contributions or source waveforms of a set of brain regions
- Time-frequency analysis: analysis or display of the event-related time-locked or induced activity in the time-frequency domain
- Time-locked activity: event-related signal with similar wave shape over trials
- Induced activity: oscillatory activity occurring in a certain event-related time window with varying time lag and phase
- Oscillatory activity: activity occurring with several oscillations in a narrow frequency band; can be time-locked and/or induced
- TSE: temporal spectral evolution, change in amplitude or power over time relative to the baseline interval
- ERD/ERS: event-related (de)-synchronization, used as a synonym for TSE
- ERSP: event-related spectral perturbations, change in power or amplitude over time. This is the more general term and comprises ERD/ERS/TSE that is related to baseline.
- Correlation: correlation between two time signals, i.e. scalar product of normalized signals in time domain
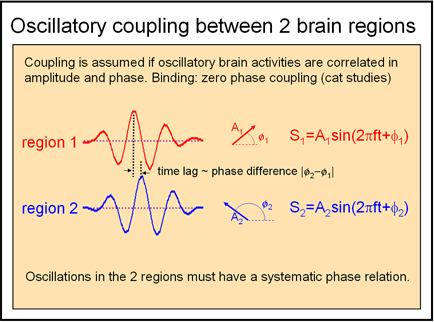
- Spectral-temporal density function S(f,t) = A(f,t)*ei*ϕ(f,t): quantifies amplitude A and phase ϕ of a signal at a certain frequency f and latency t relative to an event
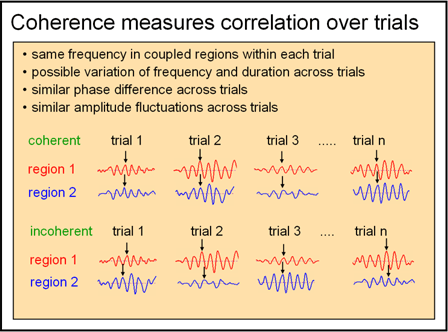
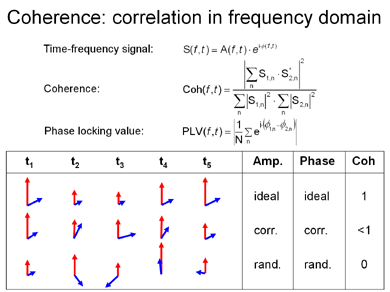
- Coherence: squared correlation of two spectral density functions S1(f,t) and S2(f,t) over trials, i.e. squared scalar product of S1(f,t) and S2(f,t) over trials, normalized across all trials
- Phase coherence: correlation of two normalized spectral density functions S1(f,t) and S2(f,t) over trials, quantified by the phase locking value (PLV)
- Phase locking value (PLV): scalar product of S1(f,t) and S2(f,t) over trials, where S1(f,t) and S2(f,t) are normalized, i.e. they become unit vectors in the complex plane
Phase coherence uses only the phase relationships between channels for the coherence estimate, not the amplitudes. The method implemented here was described by Lachaux et al. (1999). Phase coherence is described by the so-called "phase locking value" (PLV).
Comparison of the formulae for coherence and PLV illustrates that for constant amplitudes, PLV is equivalent to the square root of coherence.
Scalp Coherence
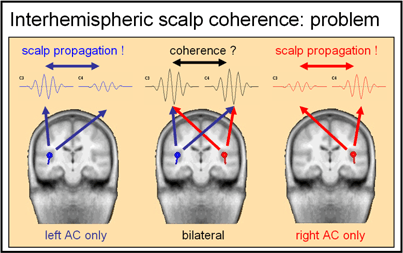
When coherence is calculated at the surface between 2 EEG channels or 2 MEG sensors, activity from various brain regions is picked up in each of the surface channels. Oscillatory activity in one brain region can already lead to a strong coherence between 2 surface channels because of the wide distribution of focal brain activity at the surface. This is due to the nature of the dipole fields when recording remotely and due to the smearing effect of the volume conduction in EEG. As a consequence, a coherence measure between surface channels cannot distinguish between coherence due to propagation and real coherence between the oscillatory activities in two coupled brain regions.
Whether true coherence can be detected at the scalp, depends mainly on the relative orientation of the source currents in the underlying brain regions and, to a lesser extent, on their distance in location. In the case of the auditory cortex, for example, both the left and right temporal planes produce vertical activity with strong bilateral contributions centrally (e.g. at C3/C4 and F3/F4). The spatial correlation of the radial activities at the lateral surfaces of the superior temporal gyrus is also very large between right and left scalp electrodes, e.g. at T3/T4. A current-source density montage (CSD or Laplacian) can reduce the effects of propagation on scalp coherence to a certain extent, because it enhances the radial current from the underlying cortex relative to more remote sources to some extent.
Source Coherence
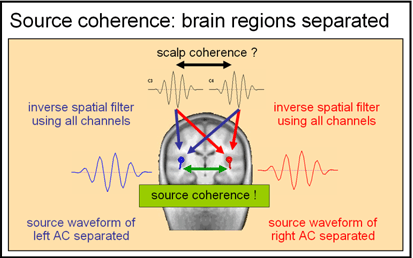
An optimal separation is obtained by a source montage derived from a multiple source model. The model is used to create an inverse spatial filter, i.e. a source montage that separates the different brain activities. Activities that are not accounted for by the model, e.g. from background noise or EEG, are distributed amongst the sources and may therefore lead to 'noise coherence' between source channels. This 'noise coherence' can be large for sources that have very similar spatial topographies. It can be reduced by increasing the regularization constant of the inverse at the expense of a larger cross-talk between the sources or by including specific sources accounting for the 'noise'.
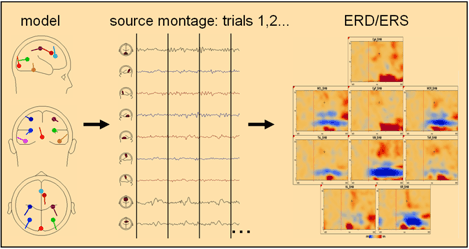
The principal steps to calculate a time-frequency diagram and source coherence are illustrated in the figure below for the real data example of error-related negativity (ERN). A multiple source model is created from averaged ERP data and/or sources in brain regions known to contribute from fMRI/PET studies using a similar task. The source model is then used to calculate a source montage and the source waveforms of the single trials. Next, every single trial is transformed into the time-frequency domain by selecting a certain temporal resolution using complex demodulation (a principle similar to FM radio). From the single trials, time-frequency displays are generated by averaging spectral density amplitude or power over trials. Source coherence is calculated by averaging the cross-spectral density of one reference channel with all other channels over trials and normalizing by the averaged auto-spectral densities (cf. figure above).
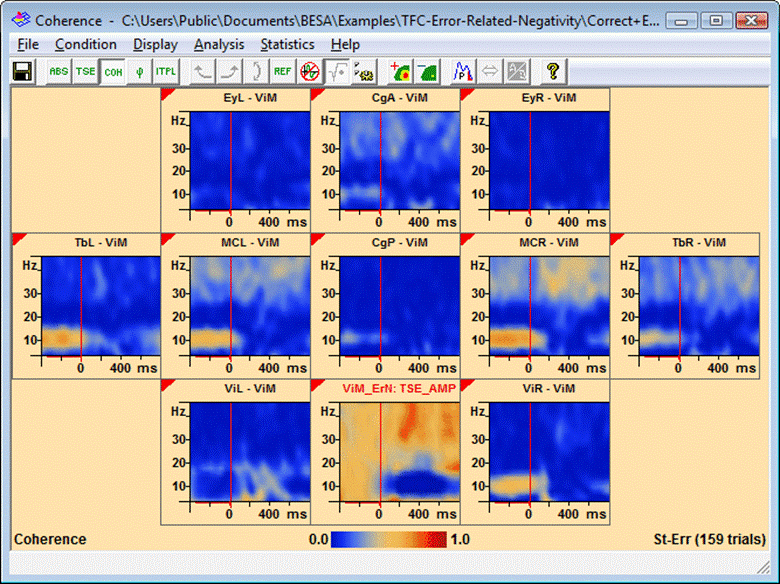
In this figure, you can see the separation of the occipital alpha rhythm (top 3 source waveforms) from the frontal midline ERN components (lowest 2 traces) which become prominent in most single trials after transforming from the 128 scalp electrodes onto 9 source areas in the brain. The time-frequency display shows a strong evoked ERN activity in the anterior and posterior cingulate gyrus (CG) sources and an induced suppression and rebound of ~20 Hz activity in the sensori-motor cortex bilaterally. Alpha suppression is most prominent in the midline occipital source. A double click onto the TF display of a selected channel leads to the rapid calculation of the coherence between this channel and all other channels.
Layout of the Source Coherence Window
The source coherence window consists of
- title bar with information on the current display mode and the data file name
- menu bar where the display mode and analysis options are selected
- toolbar for quick access to the menu functions
- display area where time-frequency diagrams of all channels are shown
- information text about the current display mode and units (e.g. Power, Amplitude, or Coherence) at the bottom left
- color map with minimum and maximum normalization values at the center bottom. Any value higher or lower than the normalization value is assigned the color of the normalization value
- information text about the condition which is analyzed at the bottom right
- status bar with information about the channel, frequency, latency, and signal amplitude
| Review | |
|---|---|
| Source Analysis | |
| Integration with MRI and fMRI | |
| Source Coherence |
|
| Export | |
| MATLAB Interface | |
| Special Topics | |
