BESA Research Artifact Correction
| Module information | |
| Modules | BESA Research Basic or higher |
| Version | 6.1 or higher |
Contents
Artifact Correction
Introduction
BESA Research includes a sophisticated spatial filtering method to detect and correct artifacts. The method can be applied to any kind of artifact including EOG and EKG artifacts. Spatial topographies describing the artifacts may be defined manually or by allowing the program to scan the data automatically. Manual definition can be accomplished by marking a time range containing the artifact or a buffer with the averaged artifact. In particular, EKG artifacts should be averaged before defining the spatial topography. Once defined, the corrected data waveforms can be displayed, together with additional channels below the current montage showing the time course of the artifacts. Spatial artifact topographies can be saved to a file (*.atf), and may be recalled for later use with the same data or other data from the same subject.
Automatic artifact correction is described in the chapter Automatic Correction below. For a tutorial on using calibration data for an accurate estimation of artifact coefficients, see help chapter "Artifact Correction / Tutorial".
How correction works
Artifact correction is based on the spatial components method for correcting eye artifacts (Berg and Scherg 1994, see also Ille et al. 1997, 2002). Artifact and brain signal subspaces are described in terms of spatial topographies. The correction process consists of four steps:
- Define the topography for each type of artifact using automatic detection or manual definition
- Determine the brain signal topographies underlying the displayed EEG segment
- Reconstruct the artifact signal at each scalp electrode with a spatial filter taking into account artifact as well as brain signal subspace
- Subtract the reconstructed artifact signal from the original EEG segment
Available methods for correction
BESA Research allows artifact correction to be done in different ways. The method you choose depends on how you want to analyze your data. The methods vary in how the data is distorted by correction, and how the brain activity is modeled for the estimation of eye activity:
- Artifact-free review of the ongoing EEG. Use the PCA method (Ille et al. 2002). This is optimized to contrast the artifacts against the predominant rhythmic EEG activities.
- Analysis of averaged data waveforms (ERPs). Use the Surrogate method (Berg and Scherg 1994). Brain activity is modeled by a fixed dipole model (the "surrogate model"). Data waveforms will be distorted least if the Surrogate model is close to the dipole model of the averaged data.
- Source analysis. Use the Optimizing method (Berg and Scherg 1994). This is available in two variants:
- Develop dipole models in the presence of spatial components. This is the preferred method. Create separate averages of the uncorrected conditions and of the artifact events, e.g. blinks. All averages can be concatenated into one binary segment file (*.fsg). The averaged artifacts should then be used to define spatial components during source analysis. Thus, the time course of the artifacts and of the event-related source activity can be separated and observed in the source analysis window.
- Develop dipole models on the pre-corrected averages. Using subspace-projection (SSP), the artifact dimensions are compensated for in source models. This will lead to the same dipole models as above, but a) the time course of artifact activity is not available, and b) residual variance is lower because variance from dimensions in data space occupied by the artifact spatial components are removed from the data by SSP. It does not matter which correction method was used with BESA Research (PCA, Surrogate, or SSP) – the results of source analysis are the same.
- No artifact correction. If the data contain only a few artifacts, use artifact rejection rather than correction. This avoids the distortion resulting from correction.
Artifact correction in BESA Research distorts the data less than traditional eye artifact correction
Artifact correction can distort the data topographies and reduce or augment activities at some scalp regions, e.g. frontal scalp after eye movement correction. Therefore, maps should be interpreted with caution.
The advantage of the methods used in BESA Research over traditional approaches is that overlapping contributions of the artifacts and the EEG are separated as much as possible. In traditional approaches, a proportion of the signal on an EOG channel is always subtracted from each EEG signal. Thus, in contrast to traditional methods, the topography of the EEG is less distorted by correction based on spatial components, even if the correlation between artifact and brain activity is high.
Source Analysis takes distortion due to artifact correction into account
However much the signals may be distorted by artifact correction, the distortion can be taken into account in Source Analysis. This is accomplished using signal subspace projection (SSP, cf. Uusitalo et al. 1997), which is equivalent to the "optimizing" correction method described in Berg and Scherg (1994).
SSP is switched on in Source Analysis:
- if data were averaged with artifact correction switched on, and the averaged data were saved in BESA Research binary format (*.fsg).
- if artifact correction is switched on for any other type of file. For instance, you may have averaged a file to ASCII format. Read in the file, and load the artifact coefficients. Make sure correction is switched on.
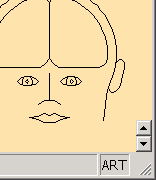
The PCA and Surrogate methods distort less than traditional EOG subtraction methods, but they do not eliminate distortion! If you do not use the first variant of the Optimizing method in source analysis, you should make sure that subspace projection (SSP) is switched on in the source analysis module. This is indicated by the text "ART" at the right of the status bar in the source analysis module. Visual feedback that SSP is switched on is supplied in the Source Module by the text ART at the right of the Status Bar:
References
Berg, P., and Scherg, M. A multiple source approach to the correction of eye artifacts, Electroenceph. clin. Neurophysiol., 1994, 90: 229-241.
Ille N., Berg P., and Scherg M. A Spatial Components Method for Continuous Artifact Correction in EEG and MEG. Biomed. Tech., 1997, 42 (suppl. 1): 80-83.
Ille, N., Berg, P., Scherg, M. Artifact correction of the ongoing EEG using spatial filters based on artifact and brain signal topographies. J. Clin. Neurophysiol. 2002, 19: 113-124.
Uusitalo, M.A., Ilmoniemi, R.J. Signal-space projection method for separating MEG or EEG into components. Med. Biol. Eng. Comput., 1997, 35: 135-140.
Artifact Correction Menu
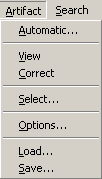
In the Review Window use the Artifact menu (Alt+A) to:
- assign EOG or ECG artifact topographies automatically
- assign artifacts manually
- display the reconstructed time course of the artifacts below the EEG
- display the EEG with the artifacts removed
- delete assigned artifacts
- select which artifact topographies to use
- display maps of the topography defining each artifact
- set options for modelling the brain signal subspace
- load a previously defined set of artifact topographies
- save the current set of artifact topographies to a file
Automatic Artifact Correction
Automatic correction is the easiest way to obtain artifact-cleared data for review. The estimation of the correction coefficients can be done using the whole EEG or an epoch defined by markers. If only one marker is set, the EEG is scanned from the beginning to the marker, or from the marker to the end, depending on the current position of the display. The longer the range, the more precisely the topography
of the artifact can be defined. However, longer ranges increase computation time.
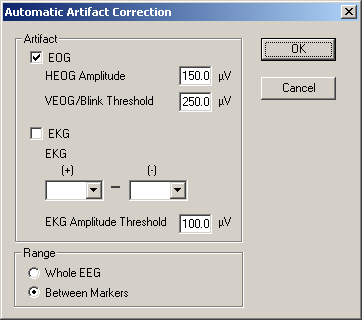
In the Review Window, select the menu entry Artifact / Automatic to bring up the artifact selection dialog box:
By default, EOG correction is computed using an internal model of eye artifact topographies. For automatic EKG correction, an EKG channel has to be defined. If markers are defined (see the figure below), the option Between Markers is ticked automatically.
Clicking OK starts the assignment of the artifact topographies, which can be interrupted at any time using the 'ESC' key on the keyboard.
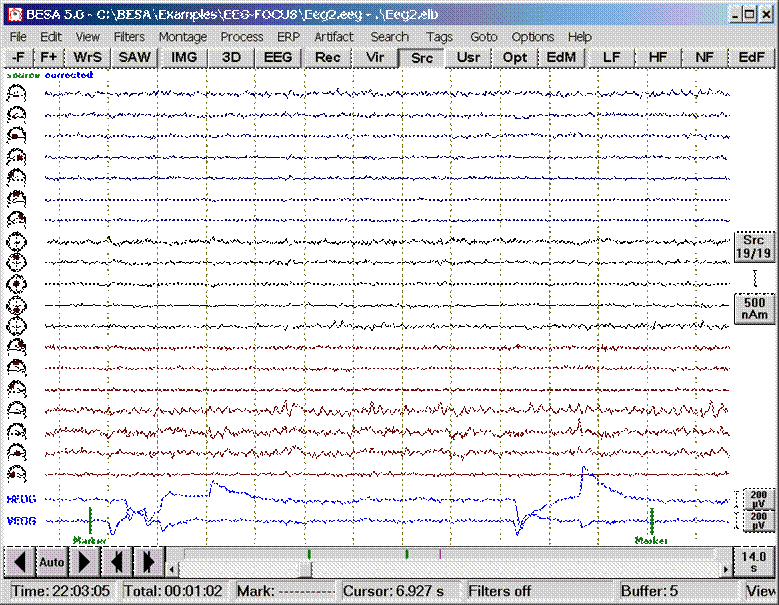
A block of EEG (the example file Examples\EEG-FOCUS\eeg2.eeg) is shown containing eye artifacts. Markers have been placed on either side of the artifacts.
Waveform display after automatic artifact correction. Virtual channels which carry the artifact signal are automatically appended at the bottom.
The corrected waveforms are shown, together with the channels HEOG and VEOG that depict the artifact signals. The oscillatory brain activity is not distorted by artifact correction. Note that correction is applied to scalp channels only. Non-scalp channels, e.g. polygraphic channels, are not corrected and are therefore unaffected by the correction.
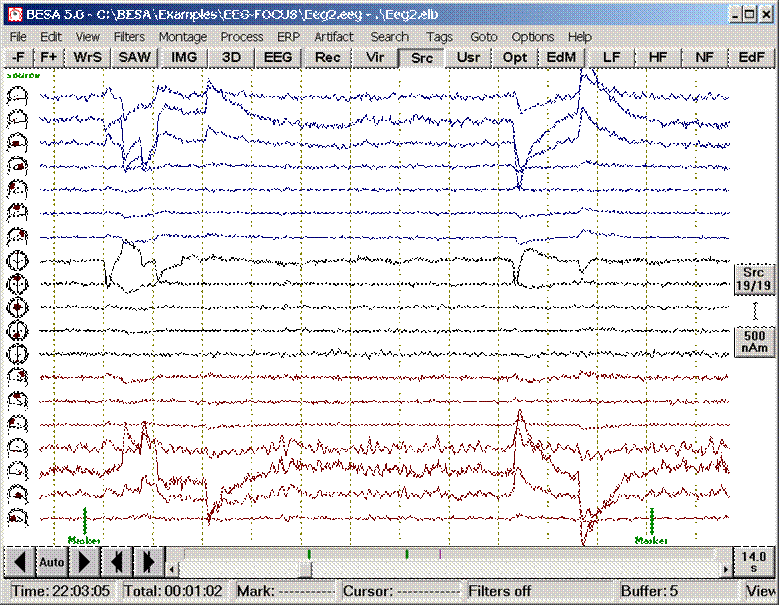
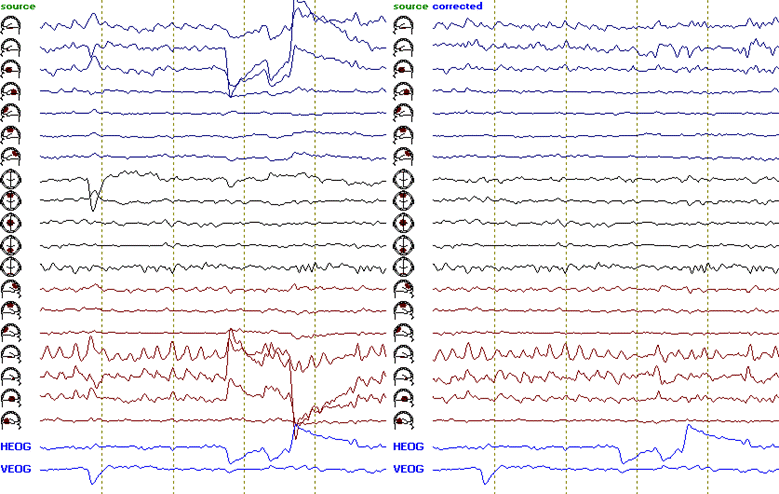
Above, a later segment of the EEG is shown, using the TA_Temporal-Lobe source montage, with and without correction. Note that, without artifact correction, the eye movements are depicted on the channels representing anterior temporal lobe and frontal brain activity. After correction, the artifacts are greatly reduced without distorting the topography of the periodic discharges.
Using Defined Topographies for Correction
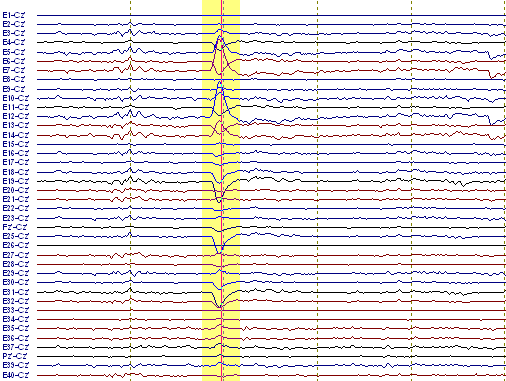
It is often desirable to use real data topographies for artifact correction, since they reflect the individual variability, e.g. in eye artifacts. The easiest way to assign an individual topography is to mark a data block which contains an artifact, and define the topography via the right click popup menu. The proceeding is as follows:
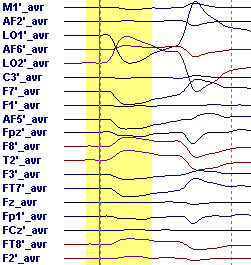
- Mark the artifact in the display window using the left mouse drag:
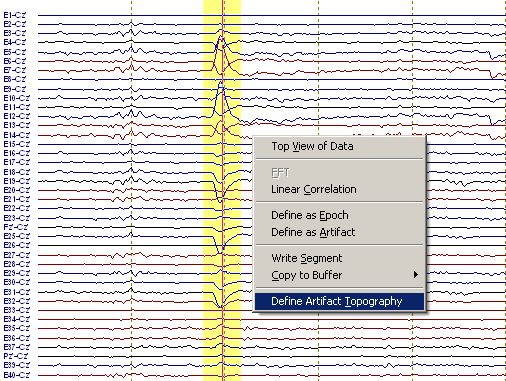
- Select the menu item Artifact / Select. Alternatively, right click and select Define Topography from the popup menu which appears:
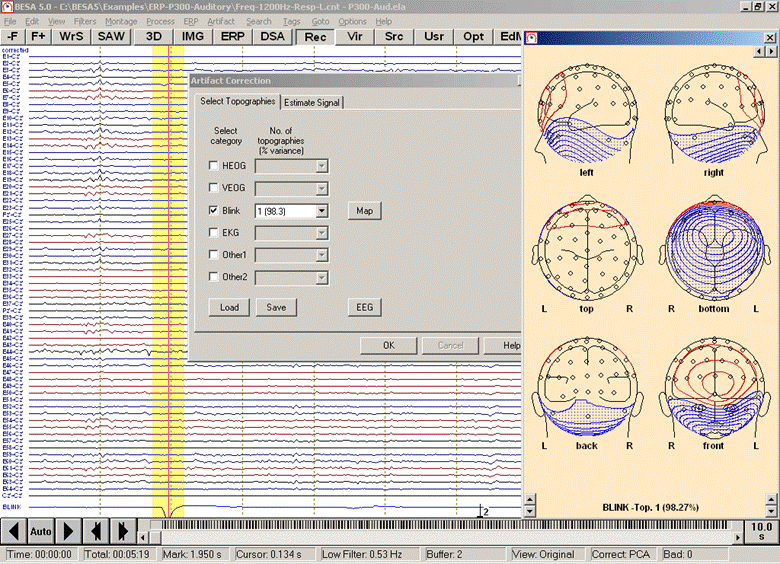
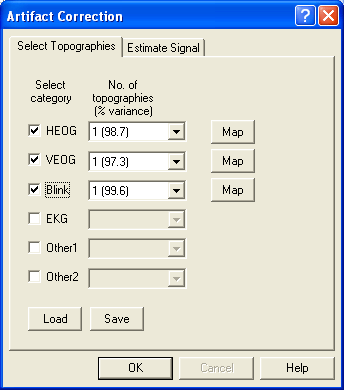
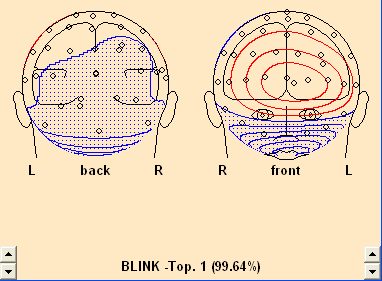
- The Select Topographies dialog box appears. There is a list of artifact types, for which topographies can be assigned. To assign a blink artifact, click into the check box in the third row. The topography is activated, and a map of the artifact topography is shown automatically:
Note that the data are automatically corrected, and an additional virtual artifact channel appears at the bottom. To switch correction off again, use the menu item Artifact / Correct which toggles correction.
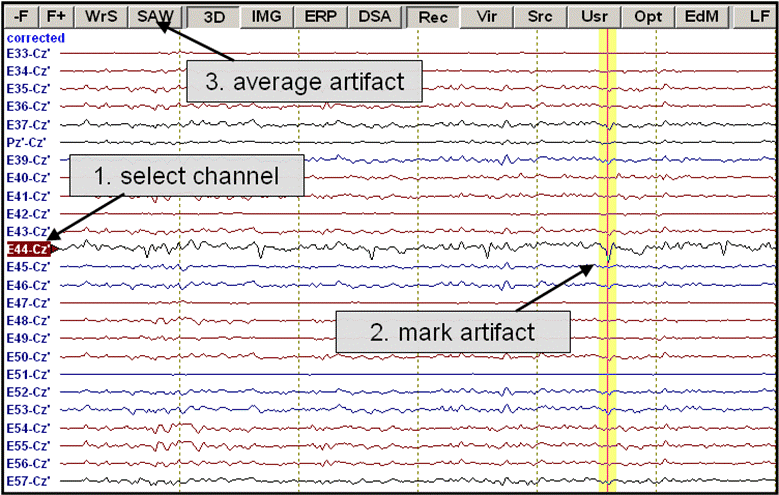
The artifact topography can be estimated with higher accuracy if a number of artifact epochs are averaged into a data buffer. This is especially recommended for correcting EKG artifacts, since the share of the overall topography which is held by the brain activity is larger for EKG artifacts. To average a number of artifacts:
- Select the channel where the artifact shows most prominently by a left click on the channel label.
- Mark the artifact in the data display.
- Press the SAW button at the top of the display window:
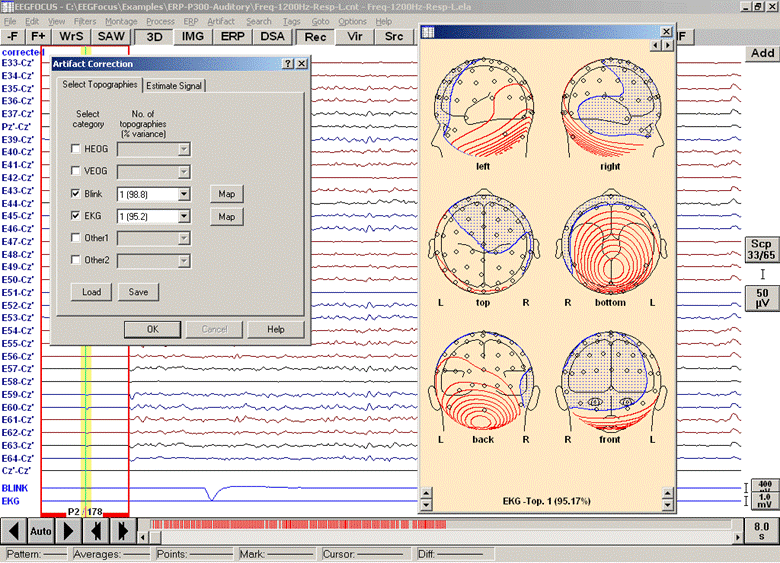
This starts an automatic average of all matching patterns in the data file. You may stop the search after a number of events were found (progress is shown in the status bar; stop averaging with the 'ESC' key). When asked for a filename to save the pattern, press Cancel. The averaged data buffer containing the artifact is shown. Now use the averaged artifact to define the artifact topography as described above for the blink artifact. When selecting the artifact category, choose EKG:
Defining a topography for an EKG artifact from an averaged EKG pattern
For the correction of EKG artifacts, it is recommended to specify a (bipolar) polygraphic EKG channel. If only scalp channels are available, the correction can work reasonably only if more than 30 channels are available and if inferior electrodes are included.
Some artifacts can contain more than one spatial component (e.g. EKG artifacts). It is possible to select more than one component for correction.
More information on artifact correction is given in the help chapter "Artifact Correction/ Tutorial".
Artifacts Tutorial: Using Calibration Data to Generate Artifact Coefficients
In this example, we will work on calibration data containing systematic eye movements:
- Each type of eye movement (left, right, up, down, blink) will be averaged separately, using pattern search.
- Correction coefficients for horizontal and vertical eye movements and blinks will be generated.
- We will obtain feedback about the coefficients: how well do these coefficients correct the calibration data?
- Using the PCA in the source analysis module, we can demonstrate the presence of rider artifacts (small eyelid movements) overlapping the saccades.
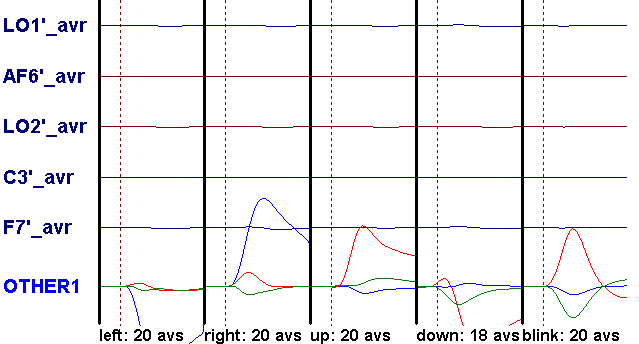
The data example, Examples\Xtras\Eye Artifacts\calibration.foc, was collected using 64 channels referred to Cz. In the eye movement calibration procedure, the subject watched a fixation point on a video monitor. At intervals of 2 s, an arrow appeared on the screen. The subject was instructed to move his eyes in the direction of the arrow to a point (marked on the wall of the shielded cabin) approximately 15° away from the fixation point, and then back to the fixation point. The subject was also instructed to try not to blink during the eye movement, but was allowed to blink while watching the fixation point. There were 20 movements in each of the directions left, right, up, down. Following these movements, the arrows were replaced by an image of an eye. This was a cue to blink. 20 eyeblinks were requested.
In the data file, trigger 1 denotes the horizontal arrows, trigger 2 the vertical arrows, and trigger 3 the eyeblinks.
Step 1: Setting up the parameters
- Load the file, Examples\Xtras\Eye Artifacts\calibration.foc.
- Set the Default Block Epoch to the range -100 ms to +400 ms (Edit/Default Block Epoch).
- Select pattern search (Search/Pattern), and make sure that the Query option is switched on (Search/Query).
- Select buffer 1 for averaging (Tags/Pattern 1).
- Set the filters to 0.5 Hz high pass, 6 db/octave, forward, and 8 Hz low pass, 12 db/octave, zero phase (Filters/Edit Filter Settings).
- Click on the Rec button and select Original Average Reference in the dropdown menu to display all 65 electrodes using the average reference.
Step 2: Examine the data
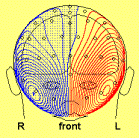
- Scan through the data to find the triggers for leftward horizontal eye movements (trigger 1). Double-click on an eye movement to view its topography. The figure shows the topography of a leftward eye movement.
- Look at maps of the vertical eye movements and the blinks.
Step 3: Pattern search and average: leftward eye movements
- Find the first horizontal (leftward) eye movement and right click just before the onset of the movement. Select ‘Default Block’ from the drop-down menu. The marked range should look something like this:
- Press the SAW (Search, Average, Write) button to start pattern search. For each segment that matches to the pattern, BESA Research will stop and ask for your confirmation.
- Accept only patterns for the onset of the eye movement (see the comments below). Reject patterns that are contaminated with blinks. Note the counter in the status bar indicating the number of averages. With this file, all 20 leftward eye movements can be included in the average. After 20 matches, pattern search may start matching up to the offset of the rightward eye movements. At this point you can press Cancel or the Escape key to terminate averaging.
- Save the averages in the suggested file, calibration.fsg. Specify the label ‘left’ for the stored segment.
- Note that the onsets of leftward eye movements are now marked with the tag number 1.
Step 4: Other eye movements
- Repeat the above procedure for the rightward eye movements. First select buffer 2 for averaging. This will assign tag number 2 to these eye movements.
- Mark the first rightward eye movement as before. Press the SAW button. Again, 20 averages can be obtained. Label the average ‘right’.
- Select buffer 3 for averaging. Repeat for the upward eye movements. 20 averages can be obtained. Use the label ‘up’.
- Select buffer 4 for averaging. Repeat for the downward eye movements. Note that the first downward eye movement is preceded by an upward saccade. Use the second movement as a template and reject the first movement from averaging. You will also need to reject the return movements from upward saccades. 19 averages will be obtained. Use the label ‘down’. Note that in this file these movements have a blink-like waveform at the onset. This may be due to eyelid movements.
- Select buffer 5 for averaging. Mark an eyeblink using a right click just before the onset of the blink. More than 20 averages can be obtained, because there are several blinks at the beginning of the data block. Make sure you do not include blinks that overlap with the eye movements. Use the label ‘blink’. Some subjects’ blinks are unnatural in the calibration file – see Comments on the Procedure, below.
- Note that the different eye movements are marked with tags 1-5. If you need to repeat the averages (e.g. with different filter settings, a different time range), you do not need to repeat pattern search – you can use the search for tagged events (Search/Tagged Events) and switch off the Query option. Once the tags are defined, a repeat average can be done very quickly. The tags we generated are saved in the file calibration_pattern_search_result.evt. These tags can be loaded using ERP/Open Event File…
Step 5: Examine the averages
- Open the file, calibration.fsg, you have just generated. Alternatively, open calibration_average.fsg, the average file we generated.
- Turn off filters and select pre-stimulus baseline (Filters/Use Prestimulus Baseline). Set the display width to 6 s.
- Look at the maps of the five different segments.
Step 6: Define artifact topographies from the averaged data* We will now define artifact topographies from the averaged data:
- Drag the cursor over the whole width of the horizontal eye movements (first two segments).
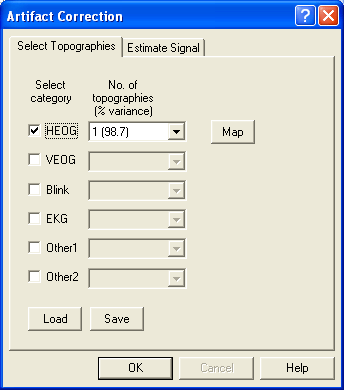
- Select Artifact/Select. In the resulting dialog, check the HEOG radio button.
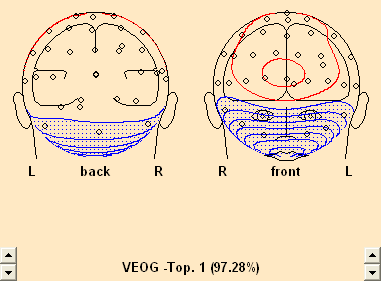
- Note a) in the dropdown list to the right of the radio button, the variance explained by the first PCA component is usually in the high 90’s for averaged eye movements. This means: a single spatial component describes the eye movement extremely well!
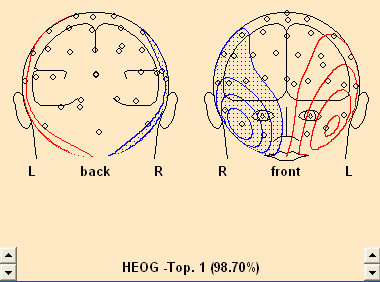
- Note b) when the check box is clicked, the mapping window is opened automatically, displaying the topography of the spatial component.
- Note c) BESA Research allows to select up to three spatial components for each artifact category, using the dropdown list. This is useful for EKG correction in MEG data, where a single component is often not sufficient for correction. A use for eye correction is illustrated below.
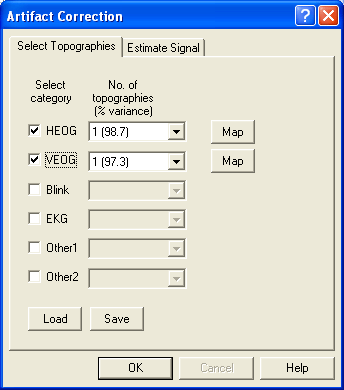
- Press OK to close the dialog. Drag the cursor over the whole width of the vertical eye movements (3rd and 4th segment).
- Select Artifact/Select. In the resulting dialog, check the HEOG radio button.
- Drag the cursor over the width of the blink segment (5th segment).
- Select Artifact/Select. In the resulting dialog, check the BLINK radio button.
- Press OK to close the dialog
- Note the appearance of the three artifact display channels at the bottom of the screen. Each channel images the activity of its eye movement type. Thus, you will see the horizontal eye movements on the right, the vertical movements in the middle, and the blink on the left. Especially during vertical eye movements, you will often see some blink activity – it seems that the eyelid is moving at the onset of the vertical movements (see figure below).
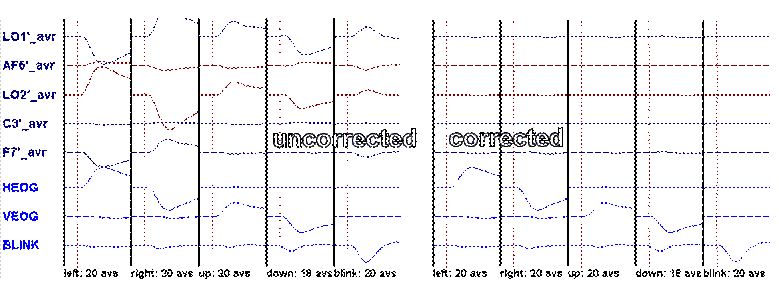
- Toggle artifact correction on and off using Artifact/Correct or the shortcut ctrl-E. To view the artifact correction signals more easily, set the EEG amplitude scaling to 200 µV, and the artifact correction signal scaling to 500 µV. Display the first quarter of the signals. Then the lower part of the display will look something like this:
Note that correction is not perfect! In particular, some artifact signal will remain on electrodes near the eyes, e.g. E5, E14. In practice, this "imperfection" is not critical: most saccades are smaller than 15°, and blinks are usually corrected very well.
- Save the artifact topographies in calibration.atf (Artifact/Save).
Step 7: Generating correction coefficients using three orthogonal spatial components
- Drag the mouse to highlight all five segments of the data.
- Select Artifact/Select. In the resulting dialog, un-check the check boxes to suppress the coefficients that were defined above.
- Check the HEOG radio button again. When asked whether to overwrite the existing coefficients, click the Yes button. As a result of deactivation and overwriting, the previously defined coefficients are removed, and new coefficients are allocated.
- Note that in the dropdown list, the first component explains about 66.5% of the data. Click on the arrow to the right of the list to show that the second component explains 29.9%, and the third component 3.1% of the data. Select the third component. This means that three components will be used for correction.
- Press OK to close the dialog.
- Note that the HEOG artifact channel now displays three waveforms in different colors. These represent the three waveforms that are subtracted from the data to remove the artifacts.
- Save the artifact topographies in calibration_orthog.atf (Artifact/Save).
Step 8: Test correction on the calibration data
- Switch back to the raw data file, calibration.foc. Select Artifact/Load and select the file calibration.atf. Artifact/Correct. As with the averaged data, correction is quite good, but not perfect on electrodes near the eyes.
- Load calibration_orthog.atf for comparison. Correction will be equivalent.
- What are the differences between these two approaches? The first method has the advantage that the artifact waveforms display the estimated activity of each type of eye movement: horizontal, vertical and blink. The second method combines these in a fairly arbitrary way, because the spatial topographies are orthogonal. The second method is simpler to apply.
- Close the raw data file (File/Close). Open it again. Note that the data are corrected, and the artifact waveforms are displayed. This is because calibration_orthog.atf has been reloaded. Open the Load Coordinate Files dialog (File/Digitized Coordinates/Head Surface Points and Sensors/Load Coordinate Files or use the shortcut ctrl-L). At the bottom of the dialog, note that the file calibration_orthog.atf has been selected in the "Artifact coefficients" section, because it has been associated with the data file in the BESA Research database.
- Select calibration.atf and press OK to associate this file with the data, and press OK.
Comments on the procedure
- Unnatural eyeblinks: In some subjects, the eyeblinks are unnatural, e.g. too long, eyes shut too tightly. In this case, we use data from a measurement data block to collect an average of eyeblinks.
- Overlapping saccades and eyeblinks: Some subjects blink a lot during the saccades. This makes it difficult to obtain a good estimate of the eye movement topographies, because the eyeblink topography dominates. Solutions to this involve a) trying to use time ranges where the saccade dominates to estimate its topography, or b) using the first three components of a PCA of the combined averaged eye movements.
- Filter settings: the 0.5 – 8 Hz filters improves the signal-to-noise ratio of the eye activity. This filter setting is only used for averaging an estimating the eye movement topographies. For artifact correction, any filter setting can be used.
- Averaging to the onset of the eye movements: Pattern search often finds a match to the offset of an eye movement (e.g. searching for a leftward movement matches up to the return movements from the right saccade). In many cases, it would probably do no harm to the correction to include these segments in the average. However, we often find that the return movements are contaminated by blinks, so we usually exclude them from the averages.
- Pre-stimulus baseline: The averages are generated so that the pre-stimulus baseline is before the eye movement or blink onset. When the pre-stimulus baseline option is selected on the average, we can obtain the topography of the eye movement relative to this baseline, i.e. relative to the fixation point. This is important for best correction results. Using a forward low cutoff filter ensures that the topography of the eye movement does not bleed back into the baseline.
- Time range: Some subjects keep their eyes on the target for a shorter time. We generally adapt the time range for pattern search so that the end of the time range is in the middle of the target and not after movement offset. This avoids including blinks that may overlap with the offset of the eye movement.
| Review | |
|---|---|
| Source Analysis | |
| Integration with MRI and fMRI | |
| Source Coherence | |
| Export | |
| MATLAB Interface | |
| Special Topics | |
